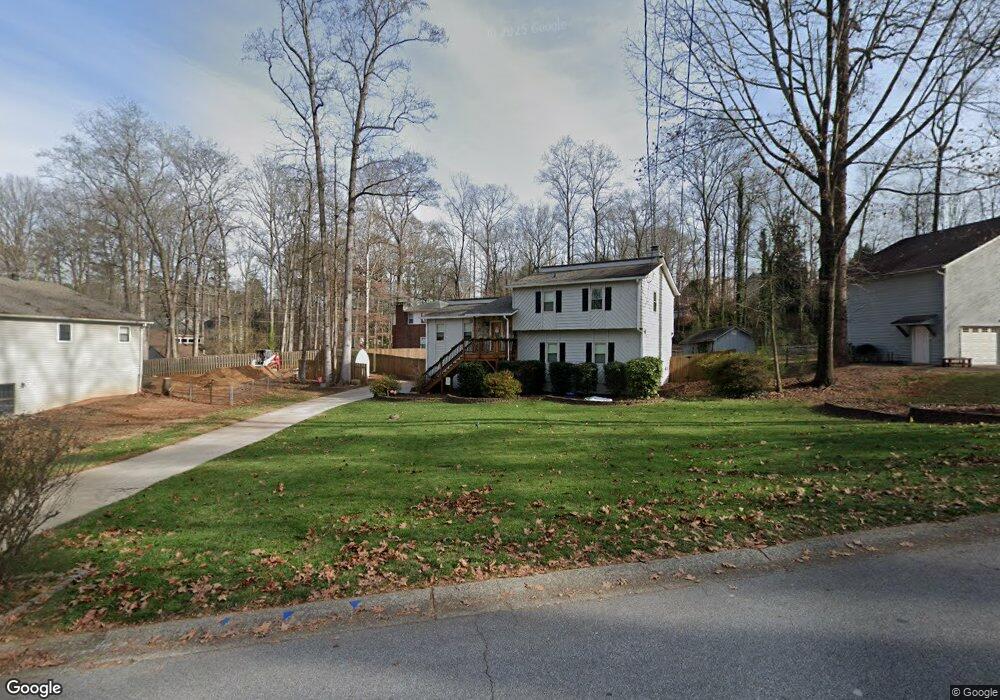
5015 River Valley Dr SE Smyrna, GA 30082
Estimated Value: $418,000 - $526,000
3
Beds
3
Baths
1,590
Sq Ft
$297/Sq Ft
Est. Value
About This Home
This home is located at 5015 River Valley Dr SE, Smyrna, GA 30082 and is currently estimated at $472,184, approximately $296 per square foot. 5015 River Valley Dr SE is a home located in Cobb County with nearby schools including King Springs Elementary School, Griffin Middle School, and Campbell High School.
Ownership History
Date
Name
Owned For
Owner Type
Purchase Details
Closed on
May 16, 2007
Sold by
Spivey Hillary K and Spivey James V
Bought by
Eskew Adam B and Eskew Cassie M
Current Estimated Value
Home Financials for this Owner
Home Financials are based on the most recent Mortgage that was taken out on this home.
Original Mortgage
$44,500
Interest Rate
6.12%
Mortgage Type
Stand Alone Refi Refinance Of Original Loan
Purchase Details
Closed on
Sep 2, 2003
Sold by
Stancil Theron H
Bought by
Spivey Hillary K and Spivey James
Home Financials for this Owner
Home Financials are based on the most recent Mortgage that was taken out on this home.
Original Mortgage
$130,000
Interest Rate
5.94%
Mortgage Type
New Conventional
Create a Home Valuation Report for This Property
The Home Valuation Report is an in-depth analysis detailing your home's value as well as a comparison with similar homes in the area
Home Values in the Area
Average Home Value in this Area
Purchase History
| Date | Buyer | Sale Price | Title Company |
|---|---|---|---|
| Eskew Adam B | $222,500 | -- | |
| Spivey Hillary K | $162,500 | -- |
Source: Public Records
Mortgage History
| Date | Status | Borrower | Loan Amount |
|---|---|---|---|
| Closed | Eskew Adam B | $44,500 | |
| Previous Owner | Spivey Hillary K | $130,000 |
Source: Public Records
Tax History Compared to Growth
Tax History
| Year | Tax Paid | Tax Assessment Tax Assessment Total Assessment is a certain percentage of the fair market value that is determined by local assessors to be the total taxable value of land and additions on the property. | Land | Improvement |
|---|---|---|---|---|
| 2025 | $4,108 | $201,220 | $56,000 | $145,220 |
| 2024 | $3,259 | $155,824 | $50,000 | $105,824 |
| 2023 | $3,231 | $180,448 | $40,000 | $140,448 |
| 2022 | $3,297 | $156,252 | $30,800 | $125,452 |
| 2021 | $2,922 | $135,528 | $30,800 | $104,728 |
| 2020 | $2,774 | $127,716 | $30,800 | $96,916 |
| 2019 | $2,774 | $127,716 | $30,800 | $96,916 |
| 2018 | $2,404 | $108,268 | $30,800 | $77,468 |
| 2017 | $2,297 | $108,268 | $30,800 | $77,468 |
| 2016 | $1,900 | $87,312 | $30,800 | $56,512 |
| 2015 | $1,778 | $78,768 | $23,200 | $55,568 |
| 2014 | $1,715 | $74,664 | $0 | $0 |
Source: Public Records
Map
Nearby Homes
- 1224 Kenway Cir SE
- 951 Reed Rd SE
- 931 Hidden Falls Ln SE
- 608 Green Valley Dr
- 608 & 612 Green Valley Dr
- 634 Green Valley Dr SE
- 3941 Lake Dr SE
- 505 Bridge Ln SE
- 502 Bridge Ln SE
- 701 Rosedale Dr SE
- 904 Bridge Ln SE
- 303 Mill Pond Ct SE
- 3844 Lake Dr SE
- 576 N Thomas Ln SE
- 4381 King Valley Dr SE
- 4398 King Valley 3-5 Dr SE
- 606 Mill Pond Dr SE
- 609 Mill Pond Dr SE
- 610 Mill Pond Dr SE
- 3933 N Cooper Lake Rd SE
- 5025 River Valley Dr SE Unit 9
- 910 Reed Rd SE Unit 1
- 5005 River Valley Dr SE
- 5035 River Valley Dr SE Unit 9
- 5020 River Valley Dr SE
- 5010 River Valley Dr SE Unit 23
- 5010 River Valley Dr SE
- 924 Reed Rd SE
- 0 River Valley Dr Unit 8406384
- 0 River Valley Dr Unit 8005807
- 0 River Valley Dr Unit 7602660
- 0 River Valley Dr Unit 7078842
- 0 River Valley Dr Unit 7521724
- 0 River Valley Dr Unit 8043819
- 0 River Valley Dr Unit 7512850
- 0 River Valley Dr Unit 8867503
- 0 River Valley Dr Unit 7052171
- 0 River Valley Dr Unit 7185382
- 0 River Valley Dr
- 5030 River Valley Dr SE Unit 1