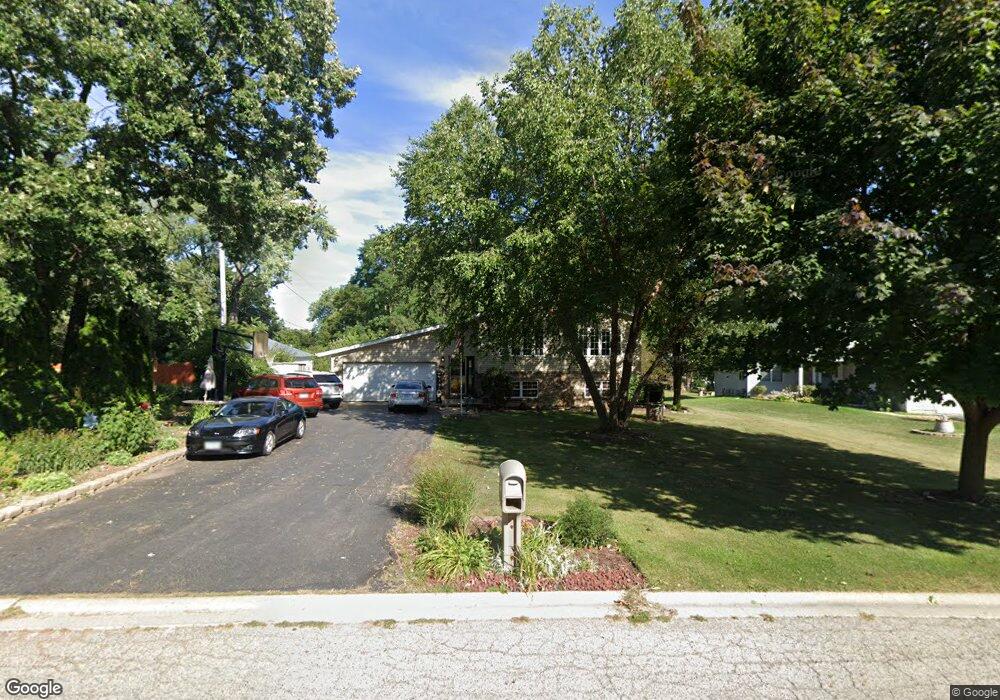
5015 Spring Rd McCullom Lake, IL 60050
Estimated Value: $278,311 - $380,000
4
Beds
--
Bath
1,372
Sq Ft
$234/Sq Ft
Est. Value
About This Home
This home is located at 5015 Spring Rd, McCullom Lake, IL 60050 and is currently estimated at $320,828, approximately $233 per square foot. 5015 Spring Rd is a home located in McHenry County with nearby schools including Valley View Elementary School, Parkland School, and Montini Catholic School.
Ownership History
Date
Name
Owned For
Owner Type
Purchase Details
Closed on
Jul 8, 2005
Sold by
Raike Shirley A
Bought by
Pociask Raymond J and Pociask Pamela L
Current Estimated Value
Home Financials for this Owner
Home Financials are based on the most recent Mortgage that was taken out on this home.
Original Mortgage
$195,500
Outstanding Balance
$95,995
Interest Rate
4.75%
Mortgage Type
Unknown
Estimated Equity
$224,833
Purchase Details
Closed on
Feb 21, 2003
Sold by
Cooper Jason R and Cooper Heide
Bought by
Raike Shirley A
Home Financials for this Owner
Home Financials are based on the most recent Mortgage that was taken out on this home.
Original Mortgage
$60,000
Interest Rate
6%
Purchase Details
Closed on
May 16, 1997
Sold by
Mchenry State Bank
Bought by
Cooper Jason R and Czyzewski Heide
Home Financials for this Owner
Home Financials are based on the most recent Mortgage that was taken out on this home.
Original Mortgage
$101,500
Interest Rate
8%
Create a Home Valuation Report for This Property
The Home Valuation Report is an in-depth analysis detailing your home's value as well as a comparison with similar homes in the area
Home Values in the Area
Average Home Value in this Area
Purchase History
| Date | Buyer | Sale Price | Title Company |
|---|---|---|---|
| Pociask Raymond J | $230,000 | Ht | |
| Raike Shirley A | $195,000 | Ticor | |
| Cooper Jason R | $32,000 | -- |
Source: Public Records
Mortgage History
| Date | Status | Borrower | Loan Amount |
|---|---|---|---|
| Open | Pociask Raymond J | $195,500 | |
| Previous Owner | Raike Shirley A | $60,000 | |
| Previous Owner | Cooper Jason R | $101,500 |
Source: Public Records
Tax History
| Year | Tax Paid | Tax Assessment Tax Assessment Total Assessment is a certain percentage of the fair market value that is determined by local assessors to be the total taxable value of land and additions on the property. | Land | Improvement |
|---|---|---|---|---|
| 2024 | $6,999 | $94,494 | $21,923 | $72,571 |
| 2023 | $6,742 | $84,657 | $19,641 | $65,016 |
| 2022 | $6,530 | $78,539 | $18,222 | $60,317 |
| 2021 | $6,195 | $73,142 | $16,970 | $56,172 |
| 2020 | $6,474 | $70,093 | $16,263 | $53,830 |
| 2019 | $6,185 | $66,559 | $15,443 | $51,116 |
| 2018 | $6,544 | $63,541 | $14,743 | $48,798 |
| 2017 | $6,503 | $59,635 | $13,837 | $45,798 |
| 2016 | $6,293 | $55,734 | $12,932 | $42,802 |
| 2013 | -- | $54,872 | $12,732 | $42,140 |
Source: Public Records
Map
Nearby Homes
- 2908 Spring Rd
- 4910 Parkview Dr
- 5310 W Orchard Dr
- 5106 W Westshore Dr
- LOT 1 Lakeside Ct
- 1918 Parklane Ave
- 4518 W Shore Dr
- 5505 W Shore Dr
- 1807 Beach Rd
- 4420 Clearview Dr
- 4817 Willow Ln
- 4218 Parkway Ave
- 4304 Clearview Dr
- 934 Lexington St
- 6114 Whiteoak Dr
- 3919 Monica Ln Unit 5
- 3917 Monica Ln Unit 4
- 3915 Monica Ln Unit 3
- 3928 Monica Ln
- 3922 Monica Ln
- 5017 Spring Rd
- 5009 W Orchard Dr
- 5005 W Orchard Dr
- 5005 W Orchard Dr
- 5011 W Orchard Dr
- 4918 W Flanders Rd
- 5019 Spring Rd
- 5001 W Orchard Dr
- Lot15 W Orchard Dr
- Lot 23 W Orchard Dr
- 5020 Spring Rd
- 4917 W Orchard Dr
- 4917 W Orchard Dr
- 5019 W Orchard Dr
- 5008 W Orchard Dr
- 5006 W Orchard Dr
- 5006 W Orchard Dr
- 5012 W Orchard Dr
- 5021 Spring Rd
- 4916 W Flanders Rd
Your Personal Tour Guide
Ask me questions while you tour the home.