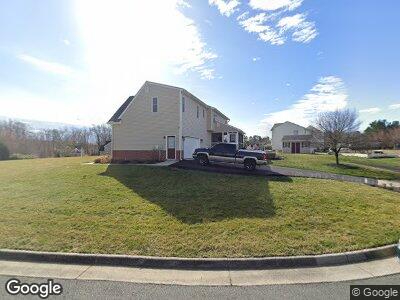
5018 Parrish Creek Place Chesterfield, VA 23832
Estimated Value: $436,000 - $466,000
4
Beds
3
Baths
2,411
Sq Ft
$189/Sq Ft
Est. Value
About This Home
This home is located at 5018 Parrish Creek Place, Chesterfield, VA 23832 and is currently estimated at $455,466, approximately $188 per square foot. 5018 Parrish Creek Place is a home located in Chesterfield County with nearby schools including Thelma Crenshaw Elementary School, Bailey Bridge Middle School, and Manchester High.
Ownership History
Date
Name
Owned For
Owner Type
Purchase Details
Closed on
Nov 5, 2015
Sold by
Coltes Rodney W and Coltes Svlvia M
Bought by
Coltes Rodney W
Current Estimated Value
Home Financials for this Owner
Home Financials are based on the most recent Mortgage that was taken out on this home.
Original Mortgage
$301,700
Outstanding Balance
$236,244
Interest Rate
3.25%
Mortgage Type
Stand Alone Refi Refinance Of Original Loan
Estimated Equity
$219,222
Purchase Details
Closed on
Oct 1, 2009
Sold by
St Clair Homes Inc
Bought by
Coltes Rodney W
Home Financials for this Owner
Home Financials are based on the most recent Mortgage that was taken out on this home.
Original Mortgage
$315,065
Interest Rate
5.12%
Mortgage Type
VA
Create a Home Valuation Report for This Property
The Home Valuation Report is an in-depth analysis detailing your home's value as well as a comparison with similar homes in the area
Home Values in the Area
Average Home Value in this Area
Purchase History
| Date | Buyer | Sale Price | Title Company |
|---|---|---|---|
| Coltes Rodney W | -- | None Available | |
| Coltes Rodney W | $305,000 | -- |
Source: Public Records
Mortgage History
| Date | Status | Borrower | Loan Amount |
|---|---|---|---|
| Open | Coltes Rodney W | $301,700 | |
| Previous Owner | Coltes Rodney W | $309,550 | |
| Previous Owner | Coltes Rodney W | $308,600 | |
| Previous Owner | Coltes Rodney W | $315,065 |
Source: Public Records
Tax History Compared to Growth
Tax History
| Year | Tax Paid | Tax Assessment Tax Assessment Total Assessment is a certain percentage of the fair market value that is determined by local assessors to be the total taxable value of land and additions on the property. | Land | Improvement |
|---|---|---|---|---|
| 2024 | $3,936 | $424,600 | $68,000 | $356,600 |
| 2023 | $3,510 | $385,700 | $67,000 | $318,700 |
| 2022 | $3,047 | $331,200 | $62,000 | $269,200 |
| 2021 | $3,047 | $313,800 | $62,000 | $251,800 |
| 2020 | $2,823 | $297,200 | $62,000 | $235,200 |
| 2019 | $2,723 | $286,600 | $60,000 | $226,600 |
| 2018 | $2,695 | $283,700 | $60,000 | $223,700 |
| 2017 | $2,575 | $268,200 | $57,000 | $211,200 |
| 2016 | $2,459 | $256,100 | $57,000 | $199,100 |
| 2015 | $2,467 | $254,400 | $57,000 | $197,400 |
| 2014 | $2,435 | $251,000 | $57,000 | $194,000 |
Source: Public Records
Map
Nearby Homes
- 4907 Misty Spring Dr
- 11418 Parrish Creek Ln
- 5107 Parrish Creek Terrace
- 10213 Carol Anne Rd
- 5313 Sandy Ridge Ct
- 10303 W Alberta Ct
- 12027 Beaver Spring Ct
- 16900 Barmer Dr
- 11518 Wiltstaff Dr
- 6160 Cedar Springs Rd
- 10900 Blossomwood Rd
- 5407 Solaris Dr
- 6301 Cedar Springs Rd
- 4430 Stigall Dr
- 5700 Qualla Rd
- 4420 Stigall Dr
- 12433 Wescott Dr
- 11311 Moravia Rd
- 4730 Bexwood Dr
- 12313 Wescott Way
- 5018 Parrish Creek Place
- 11536 Parrish Creek Ln
- 11606 Parrish Creek Ln
- 11601 Parrish Creek Ln
- 5000 Parrish Creek Place
- 5019 Parrish Creek Place
- 5007 Parrish Creek Place
- 11612 Parrish Creek Ln
- 5001 Parrish Creek Place
- 11613 Parrish Creek Ln
- 11531 Parrish Creek Ln
- 5108 Parrish Creek Ct
- 61 Parrish Creek Ct
- 11530 Parrish Creek Ln
- 11618 Parrish Creek Ln
- 11625 Parrish Creek Ln
- 11525 Parrish Creek Ln
- 5114 Parrish Creek Ct
- 11524 Parrish Creek Ln
- 11624 Parrish Creek Ln