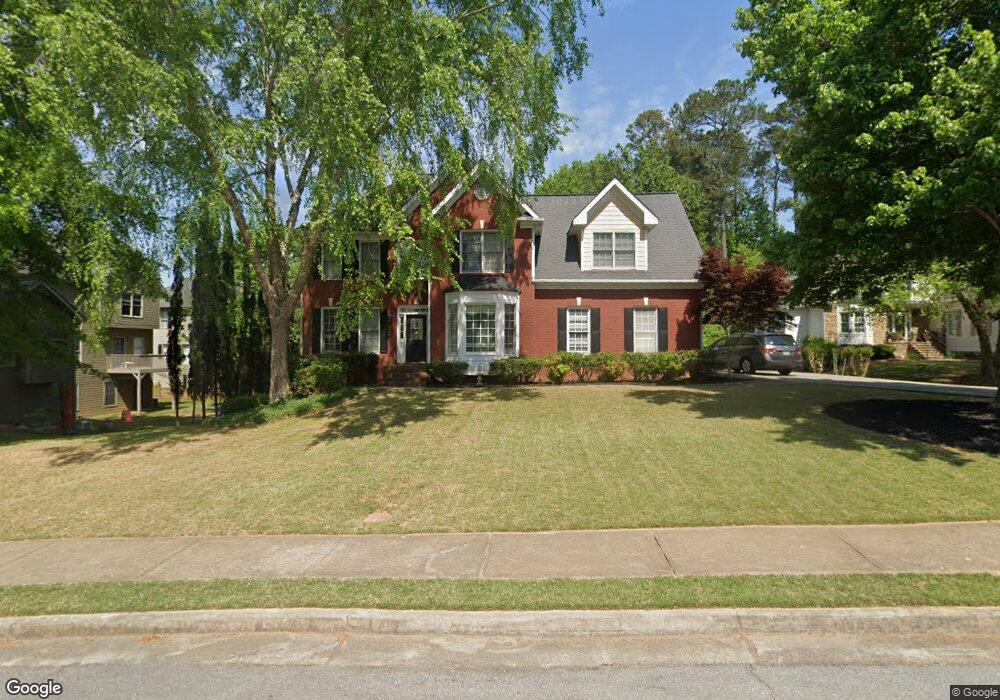
5018 Rose Walk Ct Suwanee, GA 30024
Estimated Value: $705,000 - $777,000
5
Beds
3
Baths
3,006
Sq Ft
$244/Sq Ft
Est. Value
About This Home
This home is located at 5018 Rose Walk Ct, Suwanee, GA 30024 and is currently estimated at $732,288, approximately $243 per square foot. 5018 Rose Walk Ct is a home with nearby schools including Level Creek Elementary School, North Gwinnett Middle School, and North Gwinnett High School.
Ownership History
Date
Name
Owned For
Owner Type
Purchase Details
Closed on
Jun 10, 2005
Sold by
Primacy Closing Corp
Bought by
Mccutcheon Tim
Current Estimated Value
Home Financials for this Owner
Home Financials are based on the most recent Mortgage that was taken out on this home.
Original Mortgage
$248,000
Outstanding Balance
$128,970
Interest Rate
5.7%
Mortgage Type
New Conventional
Estimated Equity
$603,318
Purchase Details
Closed on
Mar 11, 2002
Sold by
Frost Michael K and Frost Carole T
Bought by
Olson Dallas S and Olson Ashley S
Home Financials for this Owner
Home Financials are based on the most recent Mortgage that was taken out on this home.
Original Mortgage
$124,000
Interest Rate
6.85%
Mortgage Type
New Conventional
Purchase Details
Closed on
Jul 31, 1998
Sold by
Burger Constr
Bought by
Frost Michael K
Home Financials for this Owner
Home Financials are based on the most recent Mortgage that was taken out on this home.
Original Mortgage
$183,600
Interest Rate
6.96%
Mortgage Type
New Conventional
Create a Home Valuation Report for This Property
The Home Valuation Report is an in-depth analysis detailing your home's value as well as a comparison with similar homes in the area
Home Values in the Area
Average Home Value in this Area
Purchase History
| Date | Buyer | Sale Price | Title Company |
|---|---|---|---|
| Mccutcheon Tim | $335,000 | -- | |
| Primacy Closing Corp | $335,000 | -- | |
| Olson Dallas S | $249,000 | -- | |
| Frost Michael K | $229,500 | -- |
Source: Public Records
Mortgage History
| Date | Status | Borrower | Loan Amount |
|---|---|---|---|
| Open | Primacy Closing Corp | $248,000 | |
| Previous Owner | Olson Dallas S | $124,000 | |
| Previous Owner | Frost Michael K | $183,600 |
Source: Public Records
Tax History Compared to Growth
Tax History
| Year | Tax Paid | Tax Assessment Tax Assessment Total Assessment is a certain percentage of the fair market value that is determined by local assessors to be the total taxable value of land and additions on the property. | Land | Improvement |
|---|---|---|---|---|
| 2024 | $6,992 | $254,360 | $56,000 | $198,360 |
| 2023 | $6,992 | $214,120 | $44,400 | $169,720 |
| 2022 | $6,137 | $214,120 | $44,400 | $169,720 |
| 2021 | $5,712 | $188,520 | $37,200 | $151,320 |
| 2020 | $5,302 | $167,480 | $34,000 | $133,480 |
| 2019 | $4,978 | $159,000 | $30,800 | $128,200 |
| 2018 | $4,990 | $159,000 | $30,800 | $128,200 |
| 2016 | $4,317 | $127,040 | $24,400 | $102,640 |
| 2015 | $4,357 | $127,040 | $24,400 | $102,640 |
| 2014 | -- | $120,680 | $21,200 | $99,480 |
Source: Public Records
Map
Nearby Homes
- 4863 Rosemoore Ct
- 205 Finsbury Park Ct
- 570 White Stag Ct
- 4865 Settles Point Rd
- 993 Harvest Park Ln
- 585 Settles Brook Ct
- 5006 Suwanee Dam Rd
- 5096 Akard Ct
- 487 Skiles Ct
- 5105 Harbury Ln
- 4719 Terquay Ct
- 811 Woodvale Point
- 790 Woodvale Point
- 5004 Gunnison Trace
- 4874 Kettle River Point
- 721 Woodvale Point
- 5003 Pacific Dunes Dr
- 5075 Winding Rose Dr
- 5028 Rose Walk Ct Unit 3
- 5085 Winding Rose Dr Unit 3
- 5017 Rose Walk Ct
- 5095 Winding Rose Dr
- 5045 Winding Rose Dr Unit 3
- 0 Rose Walk Ct Unit 7089194
- 0 Rose Walk Ct
- 5038 Rose Walk Ct
- 5038 Rose Walk Ct
- 5027 Rose Walk Ct Unit 3
- 5110 Gladstone Pkwy
- 5100 Gladstone Pkwy
- 5120 Gladstone Pkwy
- 5080 Winding Rose Dr Unit 3
- 5025 Winding Rose Dr
- 5037 Rose Walk Ct Unit 3
- 5090 Gladstone Pkwy
- 5105 Winding Rose Dr
- 5060 Winding Rose Dr Unit 3