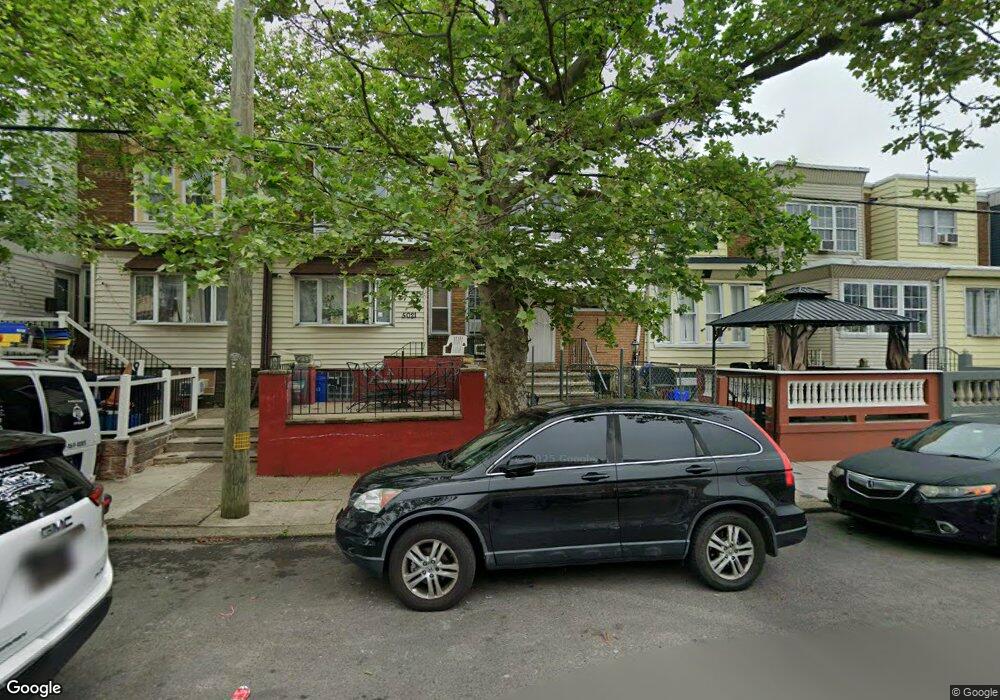
5019 C St Philadelphia, PA 19120
Feltonville NeighborhoodEstimated Value: $125,000 - $183,000
3
Beds
1
Bath
1,086
Sq Ft
$140/Sq Ft
Est. Value
About This Home
This home is located at 5019 C St, Philadelphia, PA 19120 and is currently estimated at $152,496, approximately $140 per square foot. 5019 C St is a home located in Philadelphia County with nearby schools including Barton School, Feltonville Intermediate School, and Feltonville School of Arts & Sciences.
Ownership History
Date
Name
Owned For
Owner Type
Purchase Details
Closed on
Jun 3, 2023
Sold by
Yassin Ahmad
Bought by
Maldonado Cesarina
Current Estimated Value
Home Financials for this Owner
Home Financials are based on the most recent Mortgage that was taken out on this home.
Original Mortgage
$99,170
Outstanding Balance
$96,538
Interest Rate
6.43%
Mortgage Type
FHA
Estimated Equity
$55,959
Purchase Details
Closed on
Jan 24, 2002
Sold by
Yassin Youssef
Bought by
Yassin Ahmad
Create a Home Valuation Report for This Property
The Home Valuation Report is an in-depth analysis detailing your home's value as well as a comparison with similar homes in the area
Home Values in the Area
Average Home Value in this Area
Purchase History
| Date | Buyer | Sale Price | Title Company |
|---|---|---|---|
| Maldonado Cesarina | $101,000 | None Listed On Document | |
| Yassin Ahmad | -- | -- |
Source: Public Records
Mortgage History
| Date | Status | Borrower | Loan Amount |
|---|---|---|---|
| Open | Maldonado Cesarina | $99,170 |
Source: Public Records
Tax History Compared to Growth
Tax History
| Year | Tax Paid | Tax Assessment Tax Assessment Total Assessment is a certain percentage of the fair market value that is determined by local assessors to be the total taxable value of land and additions on the property. | Land | Improvement |
|---|---|---|---|---|
| 2025 | $1,446 | $142,600 | $28,520 | $114,080 |
| 2024 | $1,446 | $142,600 | $28,520 | $114,080 |
| 2023 | $1,446 | $103,300 | $20,660 | $82,640 |
| 2022 | $848 | $103,300 | $20,660 | $82,640 |
| 2021 | $848 | $0 | $0 | $0 |
| 2020 | $848 | $0 | $0 | $0 |
| 2019 | $1,110 | $0 | $0 | $0 |
| 2018 | $1,061 | $0 | $0 | $0 |
| 2017 | $1,061 | $0 | $0 | $0 |
| 2016 | $1,061 | $0 | $0 | $0 |
| 2015 | $1,016 | $0 | $0 | $0 |
| 2014 | -- | $75,800 | $7,221 | $68,579 |
| 2012 | -- | $10,656 | $1,410 | $9,246 |
Source: Public Records
Map
Nearby Homes