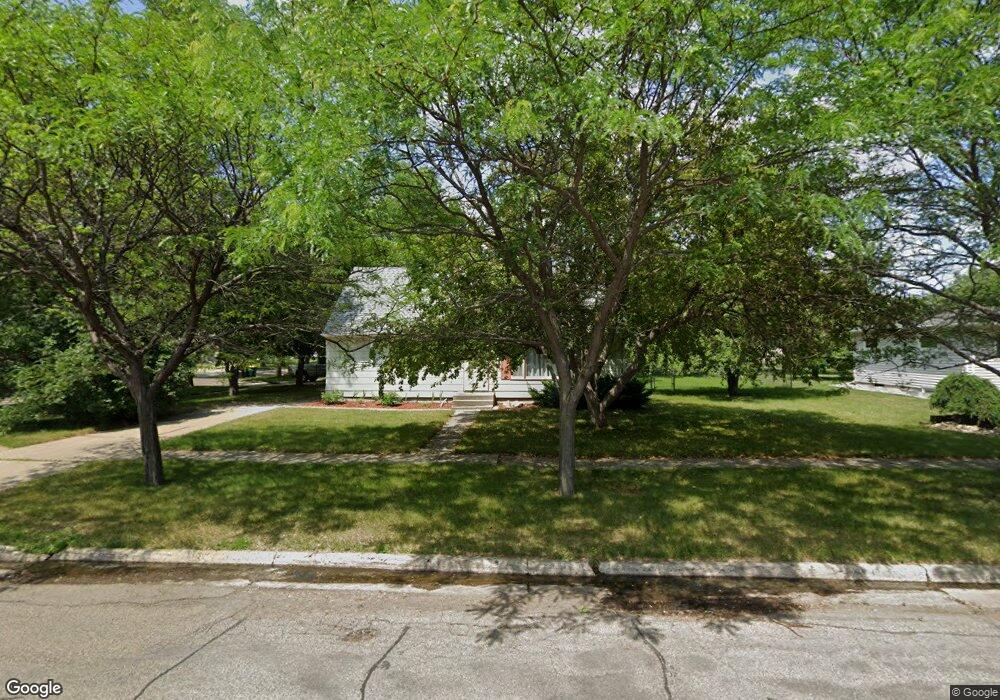
502 3rd Ave E West Fargo, ND 58078
Berger NeighborhoodEstimated Value: $266,974 - $285,000
4
Beds
3
Baths
2,592
Sq Ft
$106/Sq Ft
Est. Value
About This Home
This home is located at 502 3rd Ave E, West Fargo, ND 58078 and is currently estimated at $275,987, approximately $106 per square foot. 502 3rd Ave E is a home located in Cass County with nearby schools including L.E. Berger Elementary School, Cheney Middle School, and West Fargo High School.
Ownership History
Date
Name
Owned For
Owner Type
Purchase Details
Closed on
Feb 20, 2020
Sold by
Leininger Allyssa A and Leininger Trent
Bought by
Christianson Brittany A
Current Estimated Value
Home Financials for this Owner
Home Financials are based on the most recent Mortgage that was taken out on this home.
Original Mortgage
$144,000
Outstanding Balance
$127,502
Interest Rate
3.6%
Mortgage Type
New Conventional
Estimated Equity
$148,485
Purchase Details
Closed on
Sep 1, 2009
Sold by
Schilling James
Bought by
Wutzke Allyssa A
Home Financials for this Owner
Home Financials are based on the most recent Mortgage that was taken out on this home.
Original Mortgage
$147,283
Interest Rate
5.28%
Mortgage Type
FHA
Purchase Details
Closed on
Feb 28, 2007
Sold by
Gaullrapp Nicholas G and Gaullrapp Kathleen A
Bought by
Schilling James
Home Financials for this Owner
Home Financials are based on the most recent Mortgage that was taken out on this home.
Original Mortgage
$143,900
Interest Rate
6.27%
Mortgage Type
VA
Create a Home Valuation Report for This Property
The Home Valuation Report is an in-depth analysis detailing your home's value as well as a comparison with similar homes in the area
Home Values in the Area
Average Home Value in this Area
Purchase History
| Date | Buyer | Sale Price | Title Company |
|---|---|---|---|
| Christianson Brittany A | $180,000 | Regency Title Inc | |
| Wutzke Allyssa A | -- | -- | |
| Schilling James | -- | -- |
Source: Public Records
Mortgage History
| Date | Status | Borrower | Loan Amount |
|---|---|---|---|
| Open | Christianson Brittany A | $144,000 | |
| Previous Owner | Wutzke Allyssa A | $147,283 | |
| Previous Owner | Schilling James | $143,900 |
Source: Public Records
Tax History Compared to Growth
Tax History
| Year | Tax Paid | Tax Assessment Tax Assessment Total Assessment is a certain percentage of the fair market value that is determined by local assessors to be the total taxable value of land and additions on the property. | Land | Improvement |
|---|---|---|---|---|
| 2024 | $2,507 | $109,500 | $23,750 | $85,750 |
| 2023 | $3,062 | $110,850 | $23,750 | $87,100 |
| 2022 | $2,995 | $103,150 | $23,750 | $79,400 |
| 2021 | $2,767 | $90,600 | $17,300 | $73,300 |
| 2020 | $2,758 | $91,450 | $17,300 | $74,150 |
| 2019 | $2,973 | $99,500 | $17,300 | $82,200 |
| 2018 | $2,792 | $97,250 | $17,300 | $79,950 |
| 2017 | $2,651 | $94,300 | $17,300 | $77,000 |
| 2016 | $2,367 | $92,350 | $17,300 | $75,050 |
| 2015 | $2,289 | $81,900 | $17,800 | $64,100 |
| 2014 | $2,245 | $76,550 | $17,800 | $58,750 |
| 2013 | $2,158 | $74,450 | $15,700 | $58,750 |
Source: Public Records
Map
Nearby Homes
- 426 3rd Ave E
- 209 1st Ave E
- 78 Evergreen Cir
- 109 5th Ave W
- 109 7th Ave E
- 437 10th Ave E
- 52 Pinewood Blvd
- 237 10th Ave E
- 1059 Sommerset Place
- 851 12th Ave E
- 431 Morrison St
- 1332 Sandstone Dr
- 670 13th Ave E
- 245 12th Ave E
- 1438 Suntree Dr
- 336 13th Ave E
- 226 10 1/2 Ave W
- 243 12 1 2 Ave E
- 514 7th Ave W
- 520 6th Ave W Unit 8