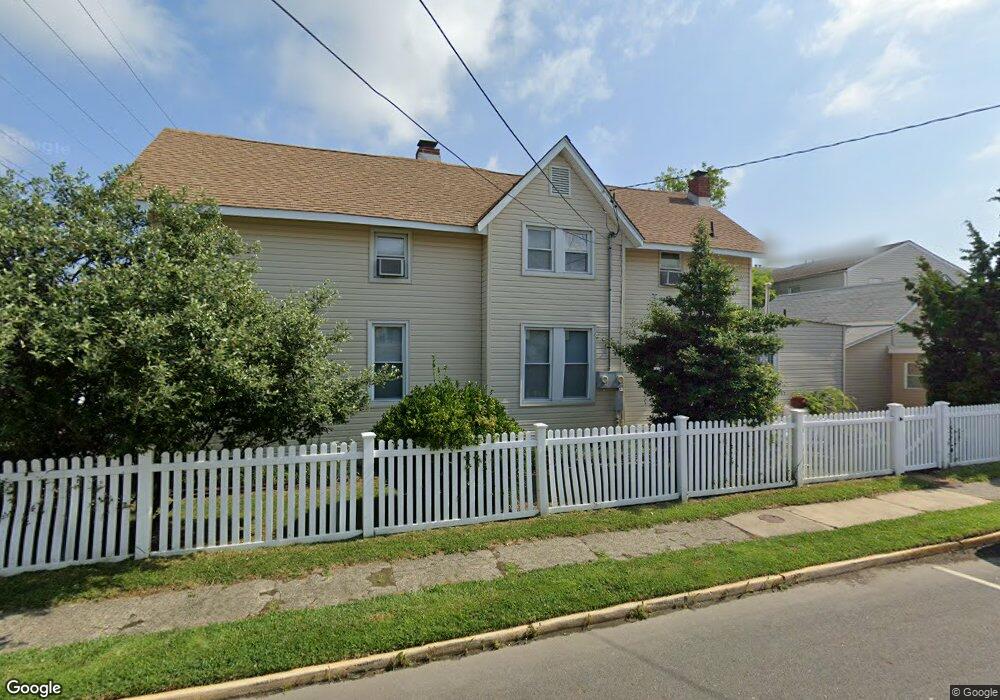
502 Bay Blvd Seaside Heights, NJ 08751
Estimated Value: $385,000 - $2,028,000
--
Bed
2
Baths
2,750
Sq Ft
$293/Sq Ft
Est. Value
About This Home
This home is located at 502 Bay Blvd, Seaside Heights, NJ 08751 and is currently estimated at $805,072, approximately $292 per square foot. 502 Bay Blvd is a home located in Ocean County with nearby schools including Hugh J. Boyd Jr. Elementary School, Central Regional Middle School, and Central Regional High School.
Ownership History
Date
Name
Owned For
Owner Type
Purchase Details
Closed on
Mar 17, 2025
Sold by
Good Cheryl
Bought by
Srisuro Chollathorn
Current Estimated Value
Purchase Details
Closed on
Feb 21, 2025
Sold by
Good Cheryl
Bought by
Good Cheryl
Purchase Details
Closed on
Aug 18, 2005
Sold by
Monaco Frank and Monaco Jean Marie
Bought by
Good Cheryl
Home Financials for this Owner
Home Financials are based on the most recent Mortgage that was taken out on this home.
Original Mortgage
$301,500
Interest Rate
5.79%
Mortgage Type
Fannie Mae Freddie Mac
Purchase Details
Closed on
Jun 26, 2001
Sold by
Leedom Lillian
Bought by
Bouhoutsos Milton and Goletsos Demitri
Create a Home Valuation Report for This Property
The Home Valuation Report is an in-depth analysis detailing your home's value as well as a comparison with similar homes in the area
Home Values in the Area
Average Home Value in this Area
Purchase History
| Date | Buyer | Sale Price | Title Company |
|---|---|---|---|
| Srisuro Chollathorn | $375,000 | Pegasus Title | |
| Srisuro Chollathorn | $375,000 | Pegasus Title | |
| Good Cheryl | -- | Trident Abstract Title | |
| Good Cheryl | -- | Trident Abstract Title | |
| Good Cheryl | $335,000 | Journeyman Title Agency Inc | |
| Bouhoutsos Milton | $110,000 | -- | |
| Bouhoutsos Milton | $110,000 | -- |
Source: Public Records
Mortgage History
| Date | Status | Borrower | Loan Amount |
|---|---|---|---|
| Previous Owner | Good Cheryl | $301,500 |
Source: Public Records
Tax History Compared to Growth
Tax History
| Year | Tax Paid | Tax Assessment Tax Assessment Total Assessment is a certain percentage of the fair market value that is determined by local assessors to be the total taxable value of land and additions on the property. | Land | Improvement |
|---|---|---|---|---|
| 2025 | $8,360 | $1,265,500 | $972,500 | $293,000 |
| 2024 | $7,759 | $295,000 | $176,000 | $119,000 |
| 2023 | $7,378 | $295,000 | $176,000 | $119,000 |
| 2022 | $7,378 | $295,000 | $176,000 | $119,000 |
| 2021 | $7,139 | $295,000 | $176,000 | $119,000 |
| 2020 | $7,163 | $295,000 | $176,000 | $119,000 |
| 2019 | $6,947 | $295,000 | $176,000 | $119,000 |
| 2018 | $6,764 | $295,000 | $176,000 | $119,000 |
| 2017 | $6,638 | $295,000 | $176,000 | $119,000 |
| 2016 | $7,410 | $335,000 | $176,000 | $159,000 |
| 2015 | $7,152 | $335,000 | $176,000 | $159,000 |
| 2014 | $6,549 | $291,800 | $176,000 | $115,800 |
Source: Public Records
Map
Nearby Homes
- 404 Bay Blvd Unit 2
- 414 Bay Blvd Unit B
- 316 Hamilton Ave
- 324 Webster Ave
- 309 Webster Ave
- 307 Webster Ave
- 305 Hamilton Ave
- 301 Webster Ave
- 303 Webster Ave
- 303 Hamilton Ave
- 322 Lincoln Ave
- 305 Franklin Ave
- 223 Webster Ave Unit 2
- 214 Franklin Ave
- 216 Sumner Ave
- 218 Sumner Ave
- 315 Grant Ave
- 8 Bay Blvd Unit 1
- 227 Grant Ave
- 235A Bay Terrace Unit A
- 504 Bay Blvd
- 508 Bay Blvd
- 328 Webster Ave Unit 1
- 328 Webster Ave
- 328 Webster Ave
- 328 Webster Ave
- 328 Webster Ave
- 328 Webster Ave
- 328 Webster Ave
- 328 Webster Ave Unit 4
- 328 Webster Ave Unit B5
- 328 Webster Ave Unit A-3
- 414 Bay Blvd
- 506 Bay Blvd
- 327 Webster Ave
- 512 Bay Blvd
- 512 Bay Blvd Unit over garage
- 329 Sumner Ave
- 406 Bay Blvd Unit A
- 406 Bay Blvd Unit C