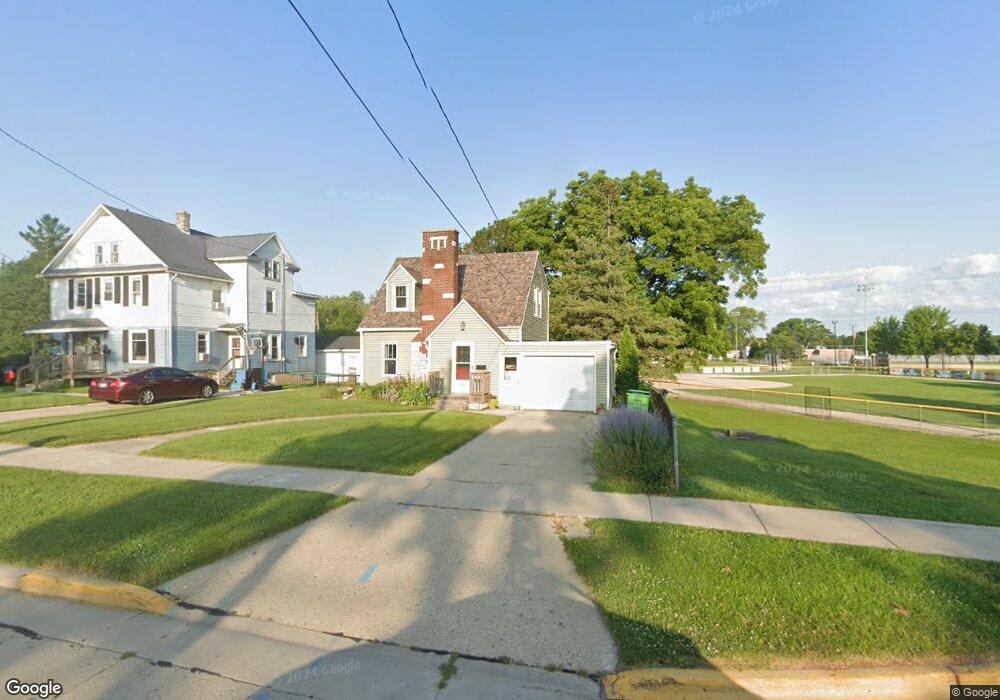
502 Declark St Beaver Dam, WI 53916
Estimated Value: $156,000 - $195,000
2
Beds
1
Bath
1,048
Sq Ft
$172/Sq Ft
Est. Value
About This Home
This home is located at 502 Declark St, Beaver Dam, WI 53916 and is currently estimated at $180,409, approximately $172 per square foot. 502 Declark St is a home located in Dodge County with nearby schools including Beaver Dam High School, St. Katharine Drexel School, and St. Stephen's Lutheran School.
Ownership History
Date
Name
Owned For
Owner Type
Purchase Details
Closed on
Jan 18, 2019
Sold by
Van Herwaarden Holdings Llc
Bought by
Henning Robin
Current Estimated Value
Home Financials for this Owner
Home Financials are based on the most recent Mortgage that was taken out on this home.
Original Mortgage
$80,900
Outstanding Balance
$70,706
Interest Rate
4.7%
Mortgage Type
New Conventional
Estimated Equity
$109,703
Purchase Details
Closed on
Nov 17, 2010
Sold by
Waarden Allen Vanher and Waarden Karen Van Her
Bought by
Van Herwaarden Holdings Llc
Purchase Details
Closed on
Feb 26, 2009
Sold by
Fannie Mae
Bought by
Vanvanherwaarden Allen Van and Herwaarden Karen Van
Purchase Details
Closed on
Apr 10, 2008
Sold by
Madeiros Marty S and Chase Home Finance Llc
Bought by
Federal National Mortgage Association
Create a Home Valuation Report for This Property
The Home Valuation Report is an in-depth analysis detailing your home's value as well as a comparison with similar homes in the area
Home Values in the Area
Average Home Value in this Area
Purchase History
| Date | Buyer | Sale Price | Title Company |
|---|---|---|---|
| Henning Robin | $101,900 | Prism Title Services Llc | |
| Van Herwaarden Holdings Llc | -- | -- | |
| Vanvanherwaarden Allen Van | -- | None Available | |
| Federal National Mortgage Association | -- | None Available |
Source: Public Records
Mortgage History
| Date | Status | Borrower | Loan Amount |
|---|---|---|---|
| Open | Henning Robin | $80,900 |
Source: Public Records
Tax History
| Year | Tax Paid | Tax Assessment Tax Assessment Total Assessment is a certain percentage of the fair market value that is determined by local assessors to be the total taxable value of land and additions on the property. | Land | Improvement |
|---|---|---|---|---|
| 2025 | $2,786 | $161,800 | $12,000 | $149,800 |
| 2024 | $2,599 | $152,300 | $12,000 | $140,300 |
| 2023 | $2,748 | $142,000 | $12,000 | $130,000 |
| 2022 | $2,673 | $129,200 | $12,000 | $117,200 |
| 2021 | $2,394 | $110,400 | $12,000 | $98,400 |
| 2020 | $2,320 | $101,900 | $12,000 | $89,900 |
| 2019 | $2,131 | $93,900 | $12,000 | $81,900 |
| 2018 | $2,503 | $84,500 | $12,000 | $72,500 |
| 2017 | $2,358 | $77,500 | $12,000 | $65,500 |
| 2016 | $2,204 | $78,500 | $12,000 | $66,500 |
| 2015 | $1,674 | $74,300 | $12,000 | $62,300 |
| 2014 | $1,726 | $72,000 | $12,000 | $60,000 |
Source: Public Records
Map
Nearby Homes
Your Personal Tour Guide
Ask me questions while you tour the home.