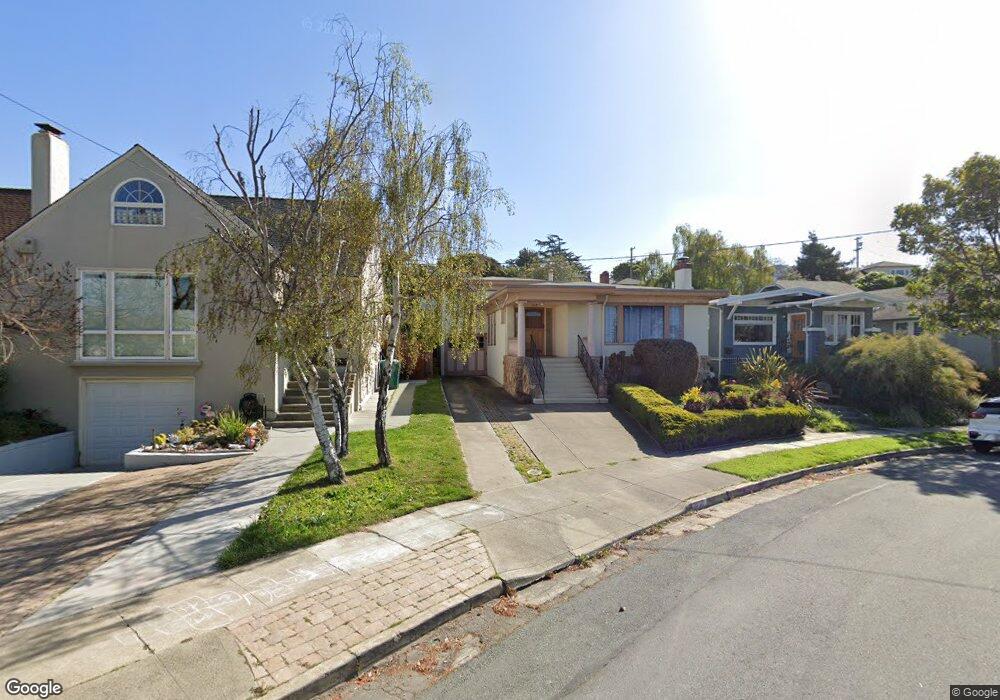
502 Dimm St Richmond, CA 94805
East Richmond NeighborhoodEstimated Value: $751,000 - $929,000
3
Beds
1
Bath
1,509
Sq Ft
$576/Sq Ft
Est. Value
About This Home
This home is located at 502 Dimm St, Richmond, CA 94805 and is currently estimated at $869,199, approximately $576 per square foot. 502 Dimm St is a home located in Contra Costa County with nearby schools including Mira Vista Elementary School, Fred T. Korematsu Middle School, and El Cerrito Senior High School.
Ownership History
Date
Name
Owned For
Owner Type
Purchase Details
Closed on
May 19, 2018
Sold by
Tsang Luisa
Bought by
Tsang Luisa Wing Tung
Current Estimated Value
Purchase Details
Closed on
Jan 6, 2016
Sold by
Tsang Kenneth Tat Chau
Bought by
Ye Mei Juan
Home Financials for this Owner
Home Financials are based on the most recent Mortgage that was taken out on this home.
Original Mortgage
$160,000
Outstanding Balance
$127,085
Interest Rate
3.92%
Mortgage Type
New Conventional
Estimated Equity
$742,114
Purchase Details
Closed on
Aug 22, 2002
Sold by
Spiers John and Spiers Frances
Bought by
Spiers John and Spiers Frances
Create a Home Valuation Report for This Property
The Home Valuation Report is an in-depth analysis detailing your home's value as well as a comparison with similar homes in the area
Home Values in the Area
Average Home Value in this Area
Purchase History
| Date | Buyer | Sale Price | Title Company |
|---|---|---|---|
| Tsang Luisa Wing Tung | -- | None Available | |
| Ye Mei Juan | -- | Old Republic Title Company | |
| Ye Mei Juan | $567,000 | Old Republic Title Company | |
| Spiers John | -- | -- | |
| Spiers John | -- | -- |
Source: Public Records
Mortgage History
| Date | Status | Borrower | Loan Amount |
|---|---|---|---|
| Open | Ye Mei Juan | $160,000 |
Source: Public Records
Tax History
| Year | Tax Paid | Tax Assessment Tax Assessment Total Assessment is a certain percentage of the fair market value that is determined by local assessors to be the total taxable value of land and additions on the property. | Land | Improvement |
|---|---|---|---|---|
| 2025 | $10,984 | $671,205 | $540,162 | $131,043 |
| 2024 | $10,586 | $658,045 | $529,571 | $128,474 |
| 2023 | $10,586 | $645,143 | $519,188 | $125,955 |
| 2022 | $10,411 | $632,494 | $509,008 | $123,486 |
| 2021 | $10,330 | $620,093 | $499,028 | $121,065 |
| 2019 | $9,816 | $601,703 | $484,228 | $117,475 |
| 2018 | $9,383 | $589,906 | $474,734 | $115,172 |
| 2017 | $9,182 | $578,340 | $465,426 | $112,914 |
| 2016 | $1,778 | $46,666 | $21,597 | $25,069 |
| 2015 | $1,523 | $45,966 | $21,273 | $24,693 |
| 2014 | $1,518 | $45,067 | $20,857 | $24,210 |
Source: Public Records
Map
Nearby Homes
Your Personal Tour Guide
Ask me questions while you tour the home.