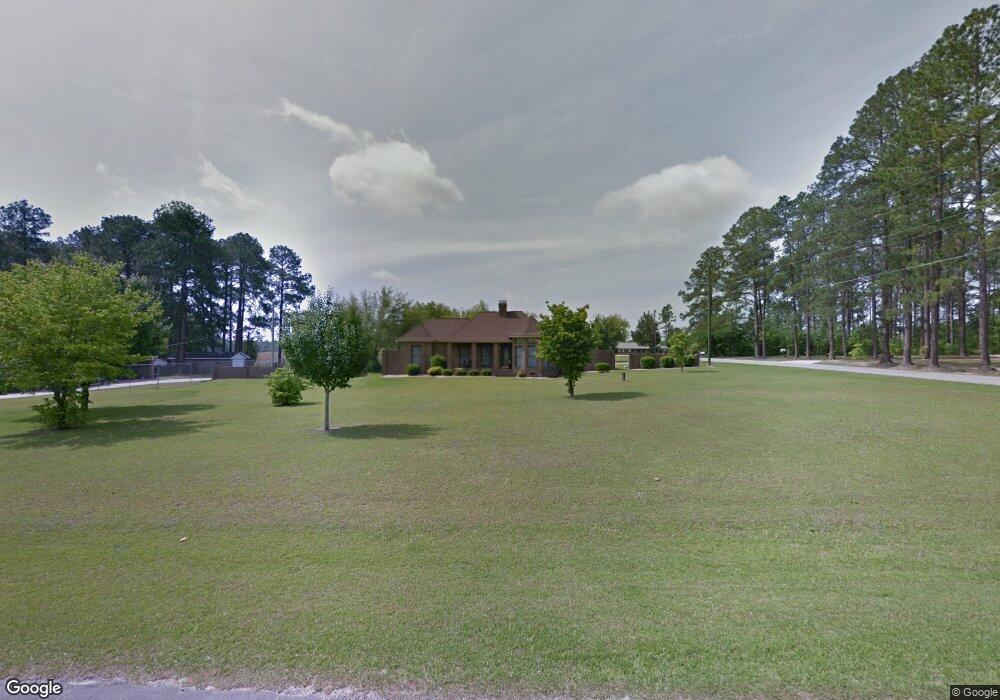
502 E 31st Ave Cordele, GA 31015
Estimated Value: $268,103 - $312,000
4
Beds
3
Baths
2,106
Sq Ft
$135/Sq Ft
Est. Value
About This Home
This home is located at 502 E 31st Ave, Cordele, GA 31015 and is currently estimated at $285,026, approximately $135 per square foot. 502 E 31st Ave is a home located in Crisp County with nearby schools including Crisp County Elementary School, Crisp County Primary School, and Crisp County Middle School.
Ownership History
Date
Name
Owned For
Owner Type
Purchase Details
Closed on
Sep 28, 2022
Sold by
Bragg Gardner Belinda
Bought by
Brown William
Current Estimated Value
Home Financials for this Owner
Home Financials are based on the most recent Mortgage that was taken out on this home.
Original Mortgage
$272,601
Outstanding Balance
$261,612
Interest Rate
5.66%
Mortgage Type
VA
Estimated Equity
$23,414
Purchase Details
Closed on
Jun 2, 2008
Sold by
Gardner Ronald E
Bought by
Gardner Belinda B
Purchase Details
Closed on
Sep 20, 2004
Sold by
Huey Pamela Nichols and Terry Le
Bought by
Gardener Ronald E
Purchase Details
Closed on
Sep 13, 2004
Sold by
Huey Terry Lee and Huey Tammy E
Bought by
Gardener Ronald E
Purchase Details
Closed on
Aug 31, 1988
Bought by
Huey Harold
Create a Home Valuation Report for This Property
The Home Valuation Report is an in-depth analysis detailing your home's value as well as a comparison with similar homes in the area
Home Values in the Area
Average Home Value in this Area
Purchase History
| Date | Buyer | Sale Price | Title Company |
|---|---|---|---|
| Brown William | $266,500 | -- | |
| Gardner Belinda B | -- | -- | |
| Gardener Ronald E | $150,000 | -- | |
| Huey Pamela Nichols | -- | -- | |
| Gardener Ronald E | -- | -- | |
| Huey Harold | $20,000 | -- |
Source: Public Records
Mortgage History
| Date | Status | Borrower | Loan Amount |
|---|---|---|---|
| Open | Brown William | $272,601 |
Source: Public Records
Tax History Compared to Growth
Tax History
| Year | Tax Paid | Tax Assessment Tax Assessment Total Assessment is a certain percentage of the fair market value that is determined by local assessors to be the total taxable value of land and additions on the property. | Land | Improvement |
|---|---|---|---|---|
| 2024 | $2,568 | $96,854 | $4,944 | $91,910 |
| 2023 | $2,590 | $92,230 | $4,944 | $87,286 |
| 2022 | $1,932 | $84,256 | $4,944 | $79,312 |
| 2021 | $2,362 | $79,662 | $4,944 | $74,718 |
| 2020 | $1,903 | $79,662 | $4,944 | $74,718 |
| 2019 | $1,888 | $79,662 | $4,944 | $74,718 |
| 2018 | $2,259 | $89,459 | $10,878 | $78,581 |
| 2017 | $2,788 | $90,659 | $10,878 | $79,781 |
| 2016 | $2,303 | $90,659 | $10,878 | $79,781 |
| 2015 | -- | $96,013 | $10,878 | $85,135 |
| 2014 | -- | $96,013 | $10,878 | $85,135 |
| 2013 | -- | $96,012 | $10,877 | $85,135 |
Source: Public Records
Map
Nearby Homes
- 615 E 28th Ave
- 618 E 27th Ave
- 607 E 27th Ave
- 1606 S 5th St
- 619 E 26th Ave
- 724 E 26th Ave
- 510 E 25th Ave
- 1022 E 29th Ave
- 616 E 23rd Ave
- 723 E 24th Ave
- 705 E 21st Ave
- 912 Rose Ln
- 720 E 20th Ave
- 1002 Camellia Dr
- 910 S 4th St
- 1506 S Joe Wright Dr
- TBD Aberdeen Circle Lt# 28
- 906 S 5th St
- 909 S 6th St
- 2298 U S 41
- 504 E 31st Ave
- 505 E 31st Ave
- 2109 S 3rd St
- 609 E 31st Ave
- 602 E 30th Ave
- 621 E 31st Ave
- 621 E 31st Ave
- 502 E 30th Ave
- 2102 S 3rd St
- 702 E 31st Ave
- 618 E 30th Ave
- 418 E 30th Ave
- 622 E 30th Ave
- 601 E 30th Ave
- 605 E 30th Ave
- 509 E 30th Ave
- 609 E 30th Ave
- W 30th Ave E Unit 3 061
- E 30th Ave E
- W 30th Ave E Unit 3 060