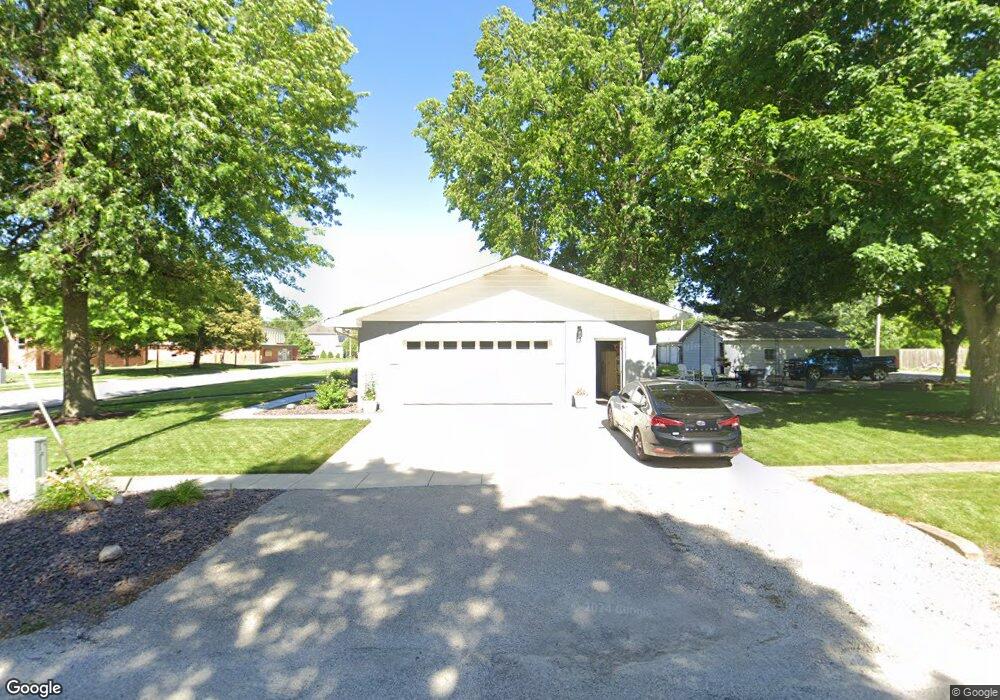
502 E Union St Nokomis, IL 62075
Estimated Value: $147,000 - $222,000
Studio
--
Bath
650
Sq Ft
$275/Sq Ft
Est. Value
About This Home
This home is located at 502 E Union St, Nokomis, IL 62075 and is currently estimated at $178,917, approximately $275 per square foot. 502 E Union St is a home located in Montgomery County with nearby schools including North Elementary School, Nokomis Junior/Senior High School, and St. Louis Catholic School.
Ownership History
Date
Name
Owned For
Owner Type
Purchase Details
Closed on
Jul 12, 2019
Sold by
Lehnen Larry P and Lehnen Sharon A
Bought by
Malley Charles F O and Malley Giovanna L O
Current Estimated Value
Home Financials for this Owner
Home Financials are based on the most recent Mortgage that was taken out on this home.
Original Mortgage
$160,000
Interest Rate
3.82%
Mortgage Type
New Conventional
Purchase Details
Closed on
Jul 15, 2008
Sold by
Lehnen Larry P and Lehnen Sharon A
Bought by
Lehnen Loren P and Lehnen Monica R
Create a Home Valuation Report for This Property
The Home Valuation Report is an in-depth analysis detailing your home's value as well as a comparison with similar homes in the area
Purchase History
| Date | Buyer | Sale Price | Title Company |
|---|---|---|---|
| Malley Charles F O | $126,000 | None Available | |
| Lehnen Loren P | -- | None Available |
Source: Public Records
Mortgage History
| Date | Status | Borrower | Loan Amount |
|---|---|---|---|
| Closed | Malley Charles F O | $160,000 |
Source: Public Records
Tax History
| Year | Tax Paid | Tax Assessment Tax Assessment Total Assessment is a certain percentage of the fair market value that is determined by local assessors to be the total taxable value of land and additions on the property. | Land | Improvement |
|---|---|---|---|---|
| 2024 | $4,084 | $52,960 | $4,370 | $48,590 |
| 2023 | $3,836 | $49,660 | $4,100 | $45,560 |
| 2022 | $3,744 | $47,720 | $3,940 | $43,780 |
| 2021 | $3,876 | $49,840 | $4,110 | $45,730 |
| 2020 | $3,698 | $47,540 | $3,920 | $43,620 |
| 2019 | $4,439 | $50,200 | $4,140 | $46,060 |
| 2018 | $3,311 | $47,260 | $3,900 | $43,360 |
| 2017 | $2,024 | $44,430 | $3,670 | $40,760 |
| 2016 | $2,024 | $43,210 | $3,570 | $39,640 |
| 2015 | $3,062 | $41,860 | $3,460 | $38,400 |
| 2013 | $2,961 | $42,370 | $3,500 | $38,870 |
Source: Public Records
Map
Nearby Homes
- 900 E Union St
- 101 W South St
- 115 W South St
- 600 Sanford Ave
- 304 N Spruce St
- 507 N Spruce St
- 318 N Cedar St
- 602 Herman St
- 416 Griffin St
- 245 S 7th St
- 185 Montgomery St
- Three Miles South of Nokomis
- 843 Monroe St
- 210 E Raymon Ave
- 638 E Ford Ave
- 529 N 2nd St
- 207 N 1st St
- 104 N 6th St
- 17095 N 17th Ave
- 203 Mary Ave
Your Personal Tour Guide
Ask me questions while you tour the home.