Estimated Value: $300,000 - $363,000
4
Beds
2
Baths
1,421
Sq Ft
$233/Sq Ft
Est. Value
About This Home
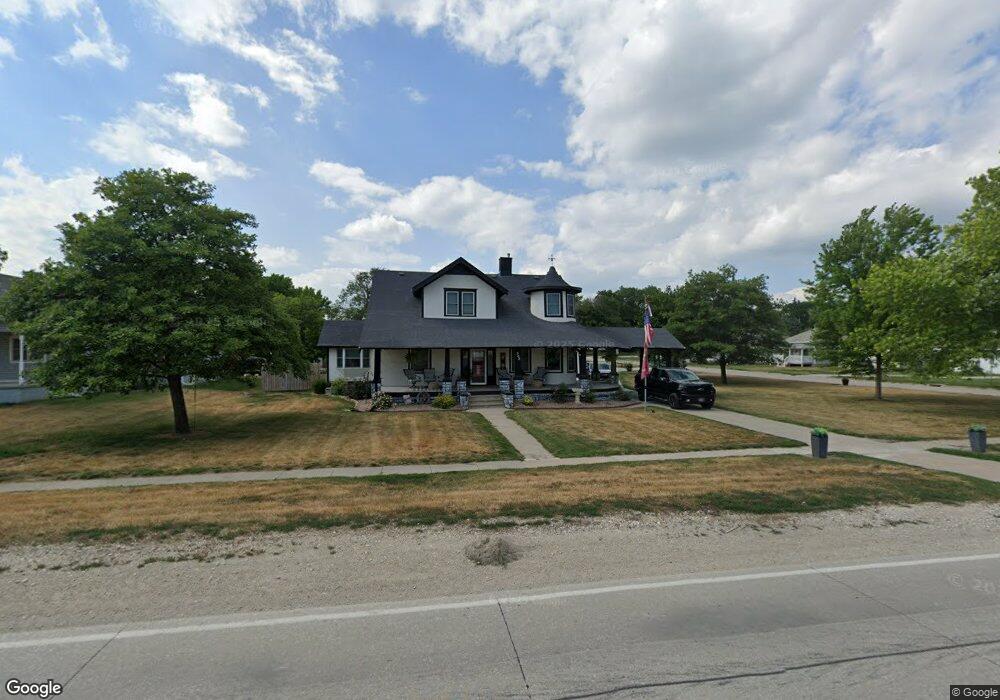
This home is located at 502 Front St, Neola, IA 51559 and is currently estimated at $330,506, approximately $232 per square foot. 502 Front St is a home located in Pottawattamie County with nearby schools including Tri-Center Elementary School, Tri-Center Middle School, and Tri-Center High School.
Ownership History
Date
Name
Owned For
Owner Type
Purchase Details
Closed on
Jan 25, 2022
Sold by
Ruth A Soppe Revocable Trust
Bought by
Cook Jimmy J and Cook Jamie M
Current Estimated Value
Home Financials for this Owner
Home Financials are based on the most recent Mortgage that was taken out on this home.
Original Mortgage
$270,000
Outstanding Balance
$249,695
Interest Rate
3.22%
Mortgage Type
New Conventional
Estimated Equity
$80,811
Purchase Details
Closed on
Jun 23, 2005
Sold by
Soppe Ruth A and Soppe Ruth Ann
Bought by
Soppe Ruth A and Ruth A Soppe Revocable Trust
Create a Home Valuation Report for This Property
The Home Valuation Report is an in-depth analysis detailing your home's value as well as a comparison with similar homes in the area
Home Values in the Area
Average Home Value in this Area
Purchase History
| Date | Buyer | Sale Price | Title Company |
|---|---|---|---|
| Cook Jimmy J | $270,000 | Fahey John P | |
| Soppe Ruth A | -- | None Available |
Source: Public Records
Mortgage History
| Date | Status | Borrower | Loan Amount |
|---|---|---|---|
| Open | Cook Jimmy J | $270,000 |
Source: Public Records
Tax History Compared to Growth
Tax History
| Year | Tax Paid | Tax Assessment Tax Assessment Total Assessment is a certain percentage of the fair market value that is determined by local assessors to be the total taxable value of land and additions on the property. | Land | Improvement |
|---|---|---|---|---|
| 2025 | $4,482 | $335,900 | $35,400 | $300,500 |
| 2024 | $4,482 | $274,300 | $30,800 | $243,500 |
| 2023 | $4,430 | $274,300 | $30,800 | $243,500 |
| 2022 | $3,528 | $193,800 | $30,800 | $163,000 |
| 2021 | $5,379 | $193,800 | $30,800 | $163,000 |
| 2020 | $3,156 | $193,800 | $30,800 | $163,000 |
| 2019 | $3,180 | $170,531 | $20,046 | $150,485 |
| 2018 | $3,104 | $170,531 | $20,046 | $150,485 |
| 2017 | $3,104 | $170,531 | $20,046 | $150,485 |
| 2015 | $3,144 | $170,531 | $20,046 | $150,485 |
| 2014 | $3,200 | $170,531 | $20,046 | $150,485 |
Source: Public Records
Map
Nearby Homes