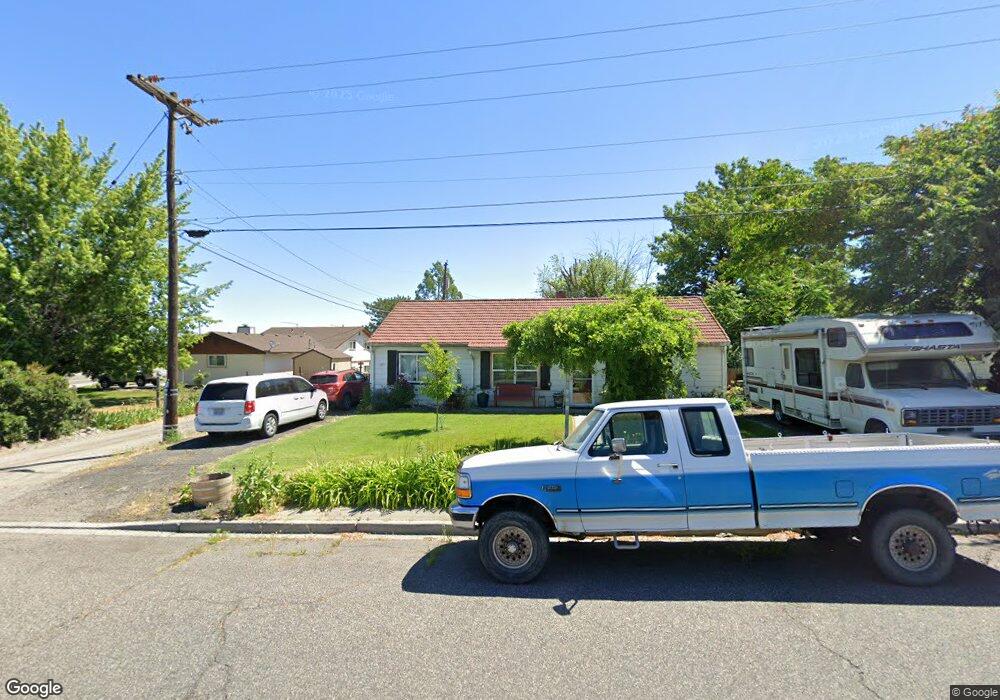
502 Mercer Ct Prosser, WA 99350
Estimated Value: $259,000 - $287,000
3
Beds
1
Bath
1,016
Sq Ft
$273/Sq Ft
Est. Value
About This Home
This home is located at 502 Mercer Ct, Prosser, WA 99350 and is currently estimated at $277,243, approximately $272 per square foot. 502 Mercer Ct is a home located in Benton County with nearby schools including Prosser High School and St Francis Preparatory School.
Ownership History
Date
Name
Owned For
Owner Type
Purchase Details
Closed on
Oct 19, 2021
Sold by
Moon Gregory and Moon Sara
Bought by
Cherry Patricia L
Current Estimated Value
Home Financials for this Owner
Home Financials are based on the most recent Mortgage that was taken out on this home.
Original Mortgage
$90,000
Outstanding Balance
$82,072
Interest Rate
2.8%
Mortgage Type
New Conventional
Estimated Equity
$195,171
Purchase Details
Closed on
Jul 20, 2009
Sold by
Hall Jeffrey and Hall Leontine
Bought by
Moon Gregory and Moon Sara
Home Financials for this Owner
Home Financials are based on the most recent Mortgage that was taken out on this home.
Original Mortgage
$125,681
Interest Rate
5.59%
Mortgage Type
FHA
Purchase Details
Closed on
Nov 25, 2008
Sold by
Massengale Gerald L and Massengale Jennifer L
Bought by
Hall Jeffrey and Hall Leontine
Purchase Details
Closed on
May 1, 2004
Sold by
Borg Ronald E and Borg Barbara G
Bought by
Massengale Gerald L and Massengale Jennifer L
Create a Home Valuation Report for This Property
The Home Valuation Report is an in-depth analysis detailing your home's value as well as a comparison with similar homes in the area
Home Values in the Area
Average Home Value in this Area
Purchase History
| Date | Buyer | Sale Price | Title Company |
|---|---|---|---|
| Cherry Patricia L | $190,000 | Chicago Title | |
| Moon Gregory | $128,000 | Chicago Title | |
| Hall Jeffrey | $73,898 | None Available | |
| Massengale Gerald L | $85,674 | Frontier Title & Esc |
Source: Public Records
Mortgage History
| Date | Status | Borrower | Loan Amount |
|---|---|---|---|
| Open | Cherry Patricia L | $90,000 | |
| Previous Owner | Moon Gregory | $125,681 |
Source: Public Records
Tax History Compared to Growth
Tax History
| Year | Tax Paid | Tax Assessment Tax Assessment Total Assessment is a certain percentage of the fair market value that is determined by local assessors to be the total taxable value of land and additions on the property. | Land | Improvement |
|---|---|---|---|---|
| 2024 | $2,619 | $203,910 | $80,000 | $123,910 |
| 2023 | $2,619 | $237,080 | $45,000 | $192,080 |
| 2022 | $2,406 | $202,600 | $45,000 | $157,600 |
| 2021 | $2,256 | $187,830 | $45,000 | $142,830 |
| 2020 | $2,187 | $177,980 | $45,000 | $132,980 |
| 2019 | $1,940 | $168,130 | $45,000 | $123,130 |
| 2018 | $1,773 | $158,280 | $45,000 | $113,280 |
| 2017 | $1,272 | $118,990 | $30,000 | $88,990 |
| 2016 | $1,271 | $118,990 | $30,000 | $88,990 |
| 2015 | $1,280 | $118,990 | $30,000 | $88,990 |
| 2014 | -- | $118,990 | $30,000 | $88,990 |
| 2013 | -- | $118,990 | $30,000 | $88,990 |
Source: Public Records
Map
Nearby Homes
- 1930 Benson Ave
- 1814 Highland Dr
- TBD Luther Ln
- 2015 Benson Ave
- Lot 4 Wine Country Rd
- Lot 3 Wine Country Rd
- Lot 2 Wine Country Rd
- Lot 5 Wine Country Rd
- 1106 Claire St
- 1937 Mountain View Dr
- 2236-2282 Frontier Rd
- 106 7th St
- 711 Guernsey St
- 618 New Gate Dr
- 1011 Sherman Ave
- 973 Campbell Dr
- 976 Campbell Dr
- 1002 Sherman Ave
- 1021 Park Ave
- 837 Court St
- 1900 Miller Ave
- 1908 Miller Ave
- 1901 Wine Country Rd
- 1910 Miller Ave
- 2 NKA lOT 6 Wine Country Rd
- 1895 Wine Country Rd
- 505 Mercer Ct
- 1903 Miller Ave
- 515 Mercer Ct
- 1911 Wine Country Rd
- 1909 Miller Ave
- 1914 Miller Ave
- 601 Mercer Ct
- 1911 Miller Ave
- 611 Mercer Ct
- 614 Mercer Ct
- 1913 Elwood Ave
- 1915 Miller Ave
- 1918 Miller Ave
- 1906 Benson Ave