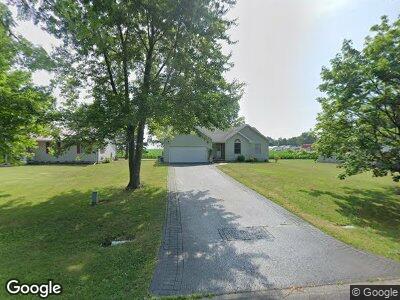
502 N Elm St Franklin Grove, IL 61031
Franklin Grove-Nachusa NeighborhoodEstimated Value: $171,772 - $252,000
--
Bed
--
Bath
1,417
Sq Ft
$150/Sq Ft
Est. Value
About This Home
This home is located at 502 N Elm St, Franklin Grove, IL 61031 and is currently estimated at $212,943, approximately $150 per square foot. 502 N Elm St is a home located in Lee County with nearby schools including Ashton-Franklin Center Elementary School, Ashton-Franklin Center Middle School, and Ashton-Franklin Center High School.
Ownership History
Date
Name
Owned For
Owner Type
Purchase Details
Closed on
Aug 18, 2017
Sold by
Searing Cullen William and Searing Melissa Ann
Bought by
Searcy Lance R and Searcy Janice L
Current Estimated Value
Home Financials for this Owner
Home Financials are based on the most recent Mortgage that was taken out on this home.
Original Mortgage
$135,988
Outstanding Balance
$116,105
Interest Rate
4.5%
Mortgage Type
FHA
Estimated Equity
$68,195
Purchase Details
Closed on
Feb 28, 2014
Sold by
Good Nicholas J and Good Crystal M
Bought by
Searing Cullen William and Searing Melissa Ann
Purchase Details
Closed on
Oct 17, 2011
Sold by
Borell Melode S and Estate Of Mary Louise Haward
Bought by
Good Nicholas J and Good Crystal M
Home Financials for this Owner
Home Financials are based on the most recent Mortgage that was taken out on this home.
Original Mortgage
$99,200
Interest Rate
4.12%
Mortgage Type
New Conventional
Create a Home Valuation Report for This Property
The Home Valuation Report is an in-depth analysis detailing your home's value as well as a comparison with similar homes in the area
Home Values in the Area
Average Home Value in this Area
Purchase History
| Date | Buyer | Sale Price | Title Company |
|---|---|---|---|
| Searcy Lance R | $138,500 | -- | |
| Searing Cullen William | $64,000 | -- | |
| Good Nicholas J | -- | None Available |
Source: Public Records
Mortgage History
| Date | Status | Borrower | Loan Amount |
|---|---|---|---|
| Open | Searcy Lance R | $135,988 | |
| Previous Owner | Good Nicholas J | $99,200 |
Source: Public Records
Tax History Compared to Growth
Tax History
| Year | Tax Paid | Tax Assessment Tax Assessment Total Assessment is a certain percentage of the fair market value that is determined by local assessors to be the total taxable value of land and additions on the property. | Land | Improvement |
|---|---|---|---|---|
| 2024 | $3,901 | $53,881 | $3,797 | $50,084 |
| 2023 | $3,415 | $46,853 | $3,302 | $43,551 |
| 2022 | $3,181 | $42,984 | $3,029 | $39,955 |
| 2021 | $3,380 | $45,057 | $2,899 | $42,158 |
| 2020 | $3,309 | $43,745 | $2,815 | $40,930 |
| 2019 | $3,263 | $42,471 | $2,733 | $39,738 |
| 2018 | $3,012 | $40,449 | $2,603 | $37,846 |
| 2017 | $2,814 | $38,130 | $2,603 | $35,527 |
| 2016 | $2,827 | $38,130 | $2,603 | $35,527 |
| 2015 | $3,380 | $38,130 | $2,603 | $35,527 |
| 2014 | $3,389 | $38,130 | $2,603 | $35,527 |
| 2013 | $2,998 | $41,333 | $3,258 | $38,075 |
Source: Public Records
Map
Nearby Homes
- 247 W Maple St
- 124 W Middle St
- 326 Old Mill Rd
- 215 W Hughes St
- Lot 4 Daysville Rd
- 1479 Old Mill Rd
- 8554 S Daysville Rd
- 1841 Robbins Rd
- 511 Richardson Ave
- 908 Main St
- 808 Evans Ave
- 1003 Cartwright Ave
- 1735 Nachusa Rd
- 110 Flambeau Ln
- 203 Flambeau Ln
- 214 Park Dr
- 107 Maple Ln
- 103 Wolf Dr
- 105 Oak Ln
- 217 Park Dr
- 502 N Elm St
- 504 N Elm St
- 105 W Maple St
- 423 N Elm St
- 105 E Lincoln Hwy
- 123 E Lincoln Hwy
- 103 W Lincoln Hwy
- 422 N Spring St
- 124 E Il Route 38
- 108 Lincoln Hwy
- 110 E Hwy 38
- 203 W Maple St
- 330 N Walnut St
- 335 N Elm St
- 206 W Maple St
- 324 N Elm St
- 215 W Maple St
- 337 N Walnut St
- 328 N Walnut St
- 200 E Lincoln Hwy