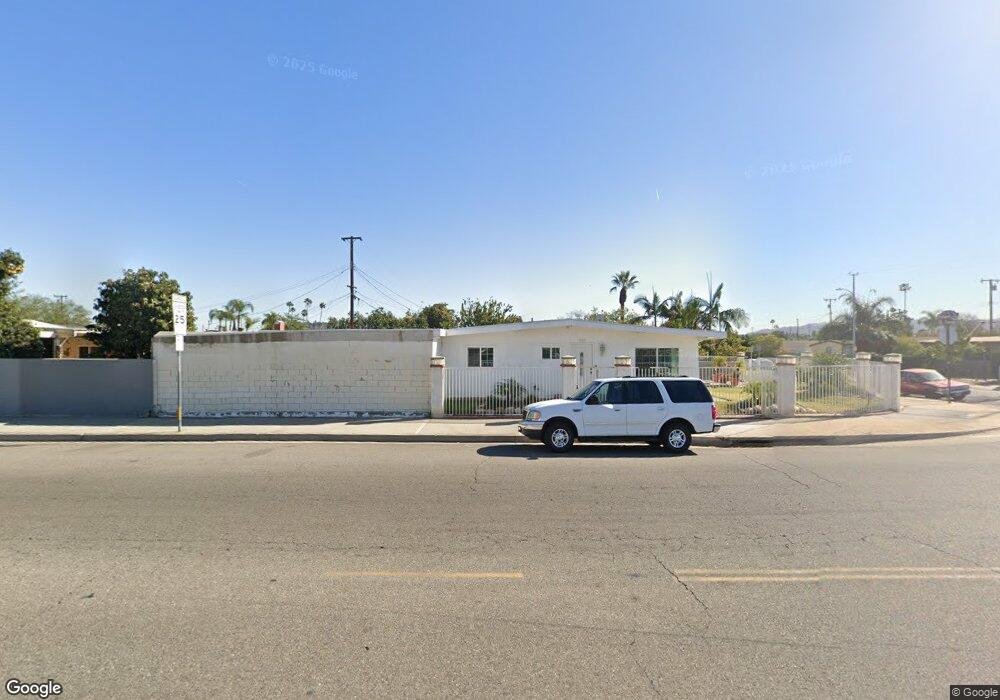
502 N Unruh Ave La Puente, CA 91744
Estimated Value: $711,000 - $768,000
3
Beds
2
Baths
1,327
Sq Ft
$550/Sq Ft
Est. Value
About This Home
This home is located at 502 N Unruh Ave, La Puente, CA 91744 and is currently estimated at $730,280, approximately $550 per square foot. 502 N Unruh Ave is a home located in Los Angeles County with nearby schools including Sparks Elementary School, Sparks Middle School, and La Puente High School.
Ownership History
Date
Name
Owned For
Owner Type
Purchase Details
Closed on
Jun 4, 2025
Sold by
Parra Linda Soledad
Bought by
Linda Soledad Parra Trust and Parra
Current Estimated Value
Purchase Details
Closed on
Feb 20, 2007
Sold by
Parra Oscar H
Bought by
Parra Linda S
Home Financials for this Owner
Home Financials are based on the most recent Mortgage that was taken out on this home.
Original Mortgage
$22,000
Interest Rate
10%
Mortgage Type
New Conventional
Purchase Details
Closed on
Jun 24, 1994
Sold by
Parra Linda S
Bought by
Parra Linda S
Home Financials for this Owner
Home Financials are based on the most recent Mortgage that was taken out on this home.
Original Mortgage
$89,000
Interest Rate
8.6%
Purchase Details
Closed on
Jun 22, 1994
Sold by
Parra Oscar H
Bought by
Parra Linda S
Home Financials for this Owner
Home Financials are based on the most recent Mortgage that was taken out on this home.
Original Mortgage
$89,000
Interest Rate
8.6%
Create a Home Valuation Report for This Property
The Home Valuation Report is an in-depth analysis detailing your home's value as well as a comparison with similar homes in the area
Home Values in the Area
Average Home Value in this Area
Purchase History
| Date | Buyer | Sale Price | Title Company |
|---|---|---|---|
| Linda Soledad Parra Trust | -- | None Listed On Document | |
| Parra Linda S | -- | Accommodation | |
| Parra Linda S | -- | Stewart Title | |
| Parra Linda S | -- | Stewart Title |
Source: Public Records
Mortgage History
| Date | Status | Borrower | Loan Amount |
|---|---|---|---|
| Previous Owner | Parra Linda S | $22,000 | |
| Previous Owner | Parra Linda S | $89,000 |
Source: Public Records
Tax History Compared to Growth
Tax History
| Year | Tax Paid | Tax Assessment Tax Assessment Total Assessment is a certain percentage of the fair market value that is determined by local assessors to be the total taxable value of land and additions on the property. | Land | Improvement |
|---|---|---|---|---|
| 2025 | $2,200 | $148,175 | $55,488 | $92,687 |
| 2024 | $2,200 | $145,270 | $54,400 | $90,870 |
| 2023 | $2,147 | $142,423 | $53,334 | $89,089 |
| 2022 | $2,090 | $139,632 | $52,289 | $87,343 |
| 2021 | $2,047 | $136,895 | $51,264 | $85,631 |
| 2019 | $1,993 | $132,837 | $49,745 | $83,092 |
| 2018 | $1,887 | $130,233 | $48,770 | $81,463 |
| 2016 | $1,752 | $125,177 | $46,877 | $78,300 |
| 2015 | $1,720 | $123,297 | $46,173 | $77,124 |
| 2014 | $1,701 | $120,883 | $45,269 | $75,614 |
Source: Public Records
Map
Nearby Homes
- 15246 Temple Ave
- 357 Cadbrook Dr
- 14940 Beckner St
- 14972 Giordano St
- 15416 Giordano St
- 750 Glenshaw Dr
- 829 Foxworth Ave
- 822 Greenberry Dr
- 14612 Hutchcroft St
- 15732 Victoria Ave
- 545 N 5th St
- 15625 Loukelton St
- 15879 Hill St
- 932 Shadydale Ave
- 15900 Rowland St
- 736 Tonopah Ave
- 826 Del Valle Ave
- 14510 Amar Rd Unit J
- 665 Larimore Ave
- 14421 Flynn St
- 15209 Prichard St
- 15202 Beckner St
- 15208 Beckner St
- 15215 Prichard St
- 15214 Beckner St
- 15202 Prichard St
- 15208 Prichard St
- 15221 Prichard St
- 15214 Prichard St
- 475 Cadbrook Dr
- 15222 Beckner St
- 509 N Unruh Ave
- 15203 Beckner St
- 515 N Unruh Ave
- 15220 Prichard St
- 445 N Unruh Ave
- 15209 Beckner St
- 15229 Prichard St
- 521 N Unruh Ave
- 15215 Beckner St