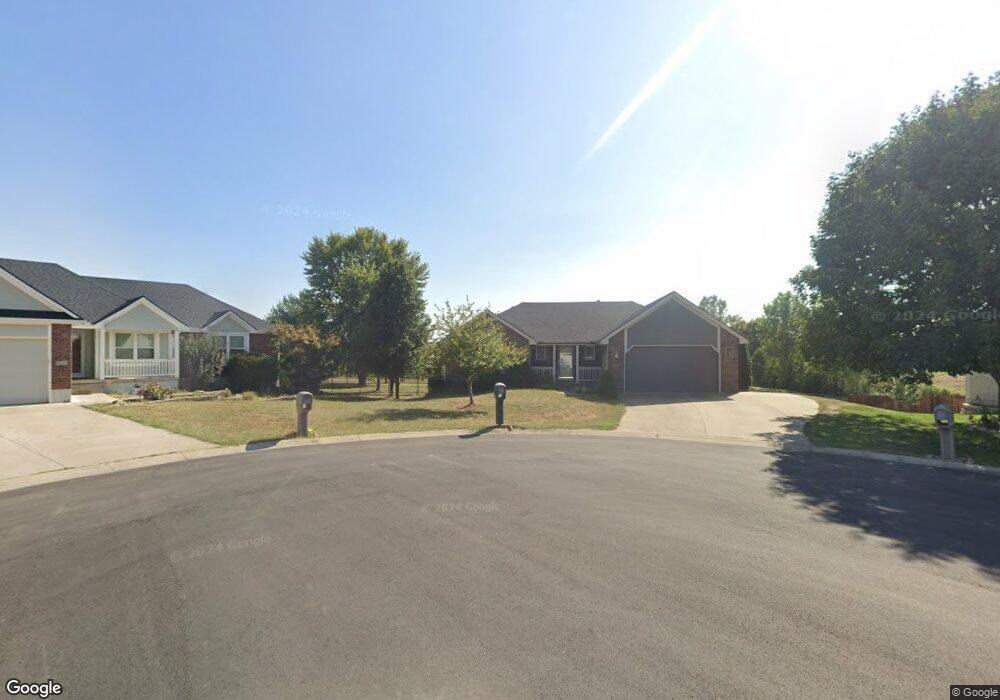
502 NW Azalea Cir Grain Valley, MO 64029
Estimated Value: $353,000 - $366,000
3
Beds
3
Baths
1,622
Sq Ft
$221/Sq Ft
Est. Value
About This Home
This home is located at 502 NW Azalea Cir, Grain Valley, MO 64029 and is currently estimated at $359,083, approximately $221 per square foot. 502 NW Azalea Cir is a home located in Jackson County with nearby schools including Grain Valley High School.
Ownership History
Date
Name
Owned For
Owner Type
Purchase Details
Closed on
Jun 25, 2024
Sold by
Fuemmeler Michael A
Bought by
Michael Fuemmeler Living Trust and Fuemmeler
Current Estimated Value
Purchase Details
Closed on
Jul 17, 2007
Sold by
Maisch Roger and Maisch Linda A
Bought by
Fuemmeler Michael A
Home Financials for this Owner
Home Financials are based on the most recent Mortgage that was taken out on this home.
Original Mortgage
$168,000
Interest Rate
6.25%
Mortgage Type
Purchase Money Mortgage
Purchase Details
Closed on
Mar 17, 2003
Sold by
Mcgraw Construction Inc
Bought by
Maisch Roger and Maisch Linda
Home Financials for this Owner
Home Financials are based on the most recent Mortgage that was taken out on this home.
Original Mortgage
$147,200
Interest Rate
5.24%
Mortgage Type
Purchase Money Mortgage
Create a Home Valuation Report for This Property
The Home Valuation Report is an in-depth analysis detailing your home's value as well as a comparison with similar homes in the area
Home Values in the Area
Average Home Value in this Area
Purchase History
| Date | Buyer | Sale Price | Title Company |
|---|---|---|---|
| Michael Fuemmeler Living Trust | -- | None Listed On Document | |
| Fuemmeler Michael A | -- | Chicago Title Insurance Co | |
| Maisch Roger | -- | Chicago Title |
Source: Public Records
Mortgage History
| Date | Status | Borrower | Loan Amount |
|---|---|---|---|
| Previous Owner | Fuemmeler Michael A | $168,000 | |
| Previous Owner | Maisch Roger | $147,200 |
Source: Public Records
Tax History Compared to Growth
Tax History
| Year | Tax Paid | Tax Assessment Tax Assessment Total Assessment is a certain percentage of the fair market value that is determined by local assessors to be the total taxable value of land and additions on the property. | Land | Improvement |
|---|---|---|---|---|
| 2025 | $4,085 | $57,029 | $12,791 | $44,238 |
| 2024 | $3,932 | $49,590 | $11,480 | $38,110 |
| 2023 | $3,932 | $49,590 | $7,209 | $42,381 |
| 2022 | $4,685 | $51,680 | $7,077 | $44,603 |
| 2021 | $4,575 | $51,680 | $7,077 | $44,603 |
| 2020 | $4,417 | $49,210 | $7,077 | $42,133 |
| 2019 | $4,327 | $50,864 | $7,077 | $43,787 |
| 2018 | $4,166 | $44,268 | $6,159 | $38,109 |
| 2017 | $4,166 | $44,268 | $6,159 | $38,109 |
| 2016 | $3,620 | $38,494 | $5,054 | $33,440 |
| 2014 | $3,214 | $33,916 | $5,715 | $28,201 |
Source: Public Records
Map
Nearby Homes
- 1206 NW Baytree Dr
- 1007 NW Long Dr
- 605 NW Silverstone Cir
- 1235 NW Ashley Ln
- 1211 NW Scenic Dr
- 704 NW Eagle Dr
- 1208 NW Golfview Dr
- 708 Pavillion Dr
- 2601 NE Wheatley Dr
- 2512 NE Wheatley Dr
- 2513 NE Wheatley Dr
- 2700 NE Crestview St
- 2605 NE Crestview St
- 2701 NE Crestview St
- 2609 NE Amanda Ln
- 2601 NE Crestview St
- 2613 NE Amanda Ln
- 2601 NE Amanda Ln
- 2705 NE Wheatley Dr
- 200 Cross Creek Ln
- 504 NW Azalea Cir
- 501 NW Azalea Cir
- 503 NW Azalea Cir
- 506 NW Azalea Cir
- 1105 NW Long Dr
- 1107 NW Long Dr
- 1113 NW Long Dr
- 1201 NW Long Dr
- 506 NW Magnolia Cir
- 504 NW Magnolia Cir
- 1203 NW Long Dr
- 1112 NW Long Dr
- 502 NW Magnolia Cir
- 1110 NW Long Dr
- 1108 NW Long Dr
- 1114 NW Long Dr
- 1106 NW Long Dr
- 500 NW Magnolia Cir
- 1200 NW Long Dr
- 1100 NW Magnolia Cir