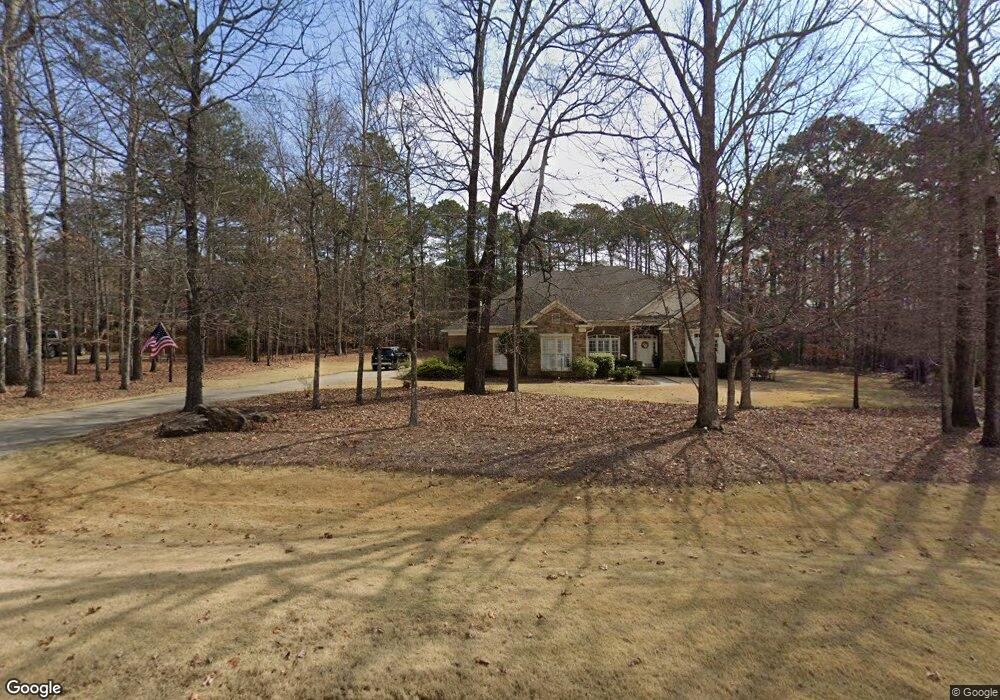
502 Pinewood Way Cataula, GA 31804
Estimated Value: $452,851 - $526,000
4
Beds
3
Baths
3,034
Sq Ft
$161/Sq Ft
Est. Value
About This Home
This home is located at 502 Pinewood Way, Cataula, GA 31804 and is currently estimated at $489,963, approximately $161 per square foot. 502 Pinewood Way is a home located in Harris County with nearby schools including Mulberry Creek Elementary School, Cogburn Woods Elementary School, and Harris County Carver Middle School.
Ownership History
Date
Name
Owned For
Owner Type
Purchase Details
Closed on
May 13, 2019
Sold by
Moultrie Roy D
Bought by
Jeffers David and Jeffers Susan
Current Estimated Value
Home Financials for this Owner
Home Financials are based on the most recent Mortgage that was taken out on this home.
Original Mortgage
$150,000
Outstanding Balance
$97,638
Interest Rate
4.1%
Mortgage Type
New Conventional
Estimated Equity
$392,325
Purchase Details
Closed on
Sep 10, 2015
Sold by
Petro Michael L
Bought by
Moultrie Roy D and Moultrie Anne
Purchase Details
Closed on
Nov 13, 2014
Sold by
Fitzpatrick Michelle
Bought by
Petro Michael
Purchase Details
Closed on
Jun 19, 2014
Sold by
Petro Mike
Bought by
Fitzpatrick Michelle
Purchase Details
Closed on
May 19, 2004
Sold by
R L Stahl Inc
Bought by
Petro Michael L
Purchase Details
Closed on
Apr 4, 2003
Sold by
Harris Developers Inc
Bought by
R L Stahl Inc
Create a Home Valuation Report for This Property
The Home Valuation Report is an in-depth analysis detailing your home's value as well as a comparison with similar homes in the area
Home Values in the Area
Average Home Value in this Area
Purchase History
| Date | Buyer | Sale Price | Title Company |
|---|---|---|---|
| Jeffers David | $338,000 | -- | |
| Moultrie Roy D | $285,000 | -- | |
| Petro Michael | -- | -- | |
| Fitzpatrick Michelle | -- | -- | |
| Petro Michael L | $360,000 | -- | |
| R L Stahl Inc | $51,400 | -- |
Source: Public Records
Mortgage History
| Date | Status | Borrower | Loan Amount |
|---|---|---|---|
| Open | Jeffers David | $150,000 |
Source: Public Records
Tax History Compared to Growth
Tax History
| Year | Tax Paid | Tax Assessment Tax Assessment Total Assessment is a certain percentage of the fair market value that is determined by local assessors to be the total taxable value of land and additions on the property. | Land | Improvement |
|---|---|---|---|---|
| 2024 | $4,303 | $159,853 | $20,400 | $139,453 |
| 2023 | $3,316 | $140,113 | $20,400 | $119,713 |
| 2022 | $3,778 | $140,113 | $20,400 | $119,713 |
| 2021 | $3,757 | $134,401 | $20,400 | $114,001 |
| 2020 | $3,757 | $134,401 | $20,400 | $114,001 |
| 2019 | $3,105 | $115,075 | $20,400 | $94,675 |
| 2018 | $3,169 | $115,075 | $20,400 | $94,675 |
| 2017 | $3,170 | $115,075 | $20,400 | $94,675 |
| 2016 | $2,866 | $132,416 | $20,400 | $112,016 |
| 2015 | $3,433 | $132,706 | $20,400 | $112,306 |
| 2014 | $3,344 | $132,706 | $20,400 | $112,306 |
| 2013 | -- | $132,706 | $20,400 | $112,306 |
Source: Public Records
Map
Nearby Homes
- 72 Mountain Lake Ct
- 511 Sweetwater Dr
- 509 Sweetwater Dr
- 95 Sweetwater Ct
- 508 Sweetwater Dr
- 218 E East Bonacre Rd
- 131 Old Gate Rd
- 654 Grey Rock Rd
- 492 Mulberry Crossing Dr
- 595 Grey Rock Dr
- 654 Grey Rock Dr
- 5905 Linley Ct
- 1278 Jones Rd
- 8000 Ivy Park Dr
- 172-6 Almond Ridge Dr
- 9536 English Ivy Ct
- 4677 Ivy Patch Dr
- 921 Grey Smoke Trail
- 304 Maple Lakes Dr
- 9410 Forest Crown Dr
- 502 Pinewood Way
- 486 Pinewood Way
- 548 Pinewood Way
- 467 Pinewood Way
- 456 Pinewood Way
- 12 Red Fox Ct
- 513 Pinewood Way
- 578 Pinewood Way
- 425 Pinewood Way
- 551 Pinewood Way
- 573 Pinewood Way
- 162 Red Fox Ct
- 912 Red Fox Ct
- 908 Red Fox Ct
- Lot 910 Red Fox Ct
- 174 Red Fox Ct
- 2 Red Fox Ct
- 402 Pinewood Way
- 22 Red Fox Ct
- 107 Red Fox Ct