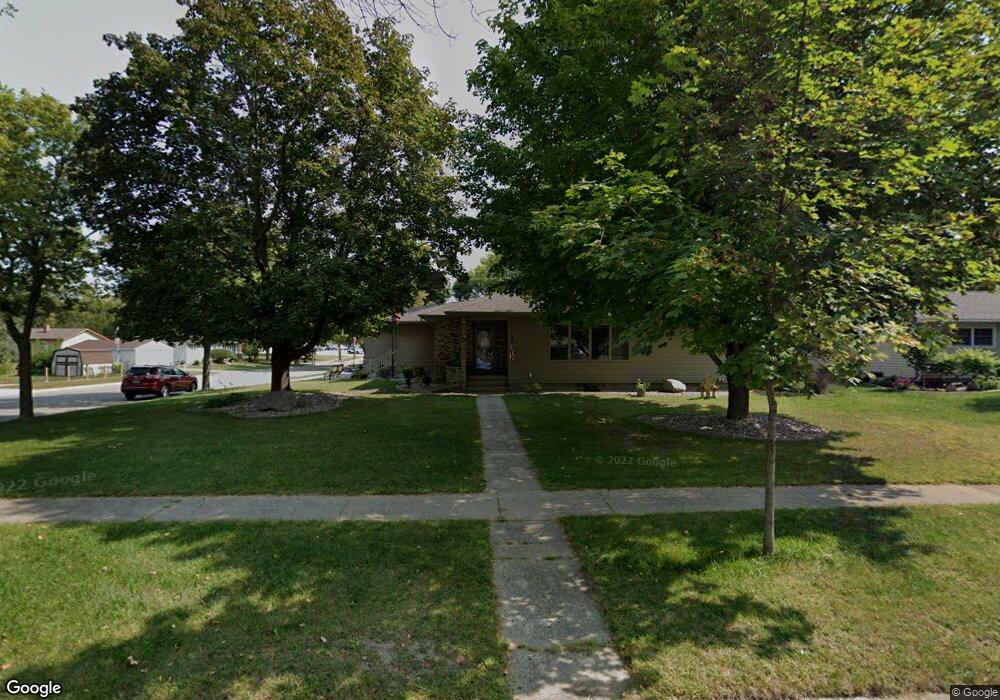
502 S 12th St Montevideo, MN 56265
Estimated Value: $346,000 - $421,000
3
Beds
4
Baths
2,979
Sq Ft
$132/Sq Ft
Est. Value
About This Home
This home is located at 502 S 12th St, Montevideo, MN 56265 and is currently estimated at $393,552, approximately $132 per square foot. 502 S 12th St is a home located in Chippewa County with nearby schools including Sanford Education Center, Ramsey Elementary School, and Montevideo Middle School.
Ownership History
Date
Name
Owned For
Owner Type
Purchase Details
Closed on
Jun 30, 2022
Sold by
James M Wik Revocable Trust
Bought by
Hagen Lynn and Hagen Cynthia
Current Estimated Value
Home Financials for this Owner
Home Financials are based on the most recent Mortgage that was taken out on this home.
Original Mortgage
$190,000
Outstanding Balance
$75,505
Interest Rate
5.25%
Mortgage Type
New Conventional
Estimated Equity
$318,047
Purchase Details
Closed on
Jul 26, 2010
Sold by
Wik James M and Wik Alta I
Bought by
Wik Alta I and Wik James M
Purchase Details
Closed on
Oct 15, 2009
Sold by
Moe Hazel M and Moe Walter W
Bought by
Moe Hazel M
Create a Home Valuation Report for This Property
The Home Valuation Report is an in-depth analysis detailing your home's value as well as a comparison with similar homes in the area
Home Values in the Area
Average Home Value in this Area
Purchase History
| Date | Buyer | Sale Price | Title Company |
|---|---|---|---|
| Hagen Lynn | $390,000 | None Listed On Document | |
| Wik Alta I | -- | None Available | |
| Moe Hazel M | -- | None Available |
Source: Public Records
Mortgage History
| Date | Status | Borrower | Loan Amount |
|---|---|---|---|
| Open | Hagen Lynn | $190,000 |
Source: Public Records
Tax History Compared to Growth
Tax History
| Year | Tax Paid | Tax Assessment Tax Assessment Total Assessment is a certain percentage of the fair market value that is determined by local assessors to be the total taxable value of land and additions on the property. | Land | Improvement |
|---|---|---|---|---|
| 2025 | $1,118 | $373,700 | $9,400 | $364,300 |
| 2024 | $1,038 | $366,500 | $9,400 | $357,100 |
| 2023 | $356 | $366,500 | $9,400 | $357,100 |
| 2022 | $4,376 | $319,100 | $9,400 | $309,700 |
| 2021 | $4,120 | $264,500 | $9,400 | $255,100 |
| 2020 | $3,552 | $228,400 | $8,200 | $220,200 |
| 2019 | $3,530 | $219,100 | $8,200 | $210,900 |
| 2018 | $3,364 | $199,726 | $0 | $0 |
| 2017 | $3,358 | $214,100 | $0 | $0 |
| 2016 | $3,268 | $196,100 | $0 | $0 |
| 2015 | -- | $196,500 | $0 | $0 |
| 2014 | -- | $185,200 | $0 | $0 |
| 2013 | -- | $185,200 | $0 | $0 |
Source: Public Records
Map
Nearby Homes