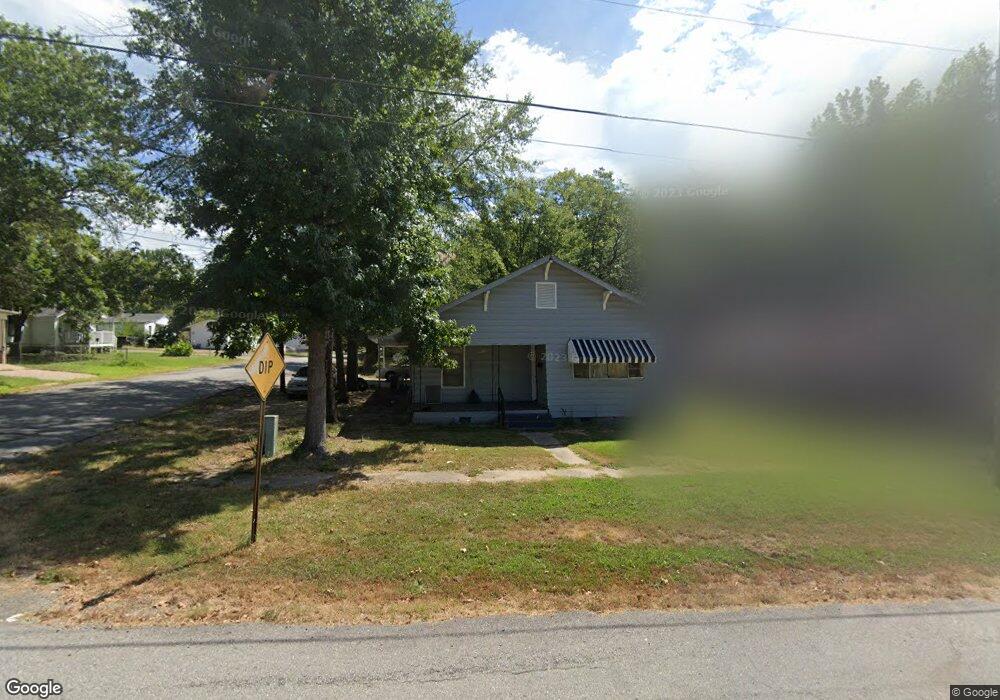
502 S 3rd St Benton, AR 72015
Estimated Value: $81,000 - $143,000
Studio
1
Bath
1,152
Sq Ft
$104/Sq Ft
Est. Value
About This Home
This home is located at 502 S 3rd St, Benton, AR 72015 and is currently estimated at $119,586, approximately $103 per square foot. 502 S 3rd St is a home located in Saline County with nearby schools including Angie Grant Elementary School, Benton Middle School, and Benton Junior High School.
Ownership History
Date
Name
Owned For
Owner Type
Purchase Details
Closed on
Sep 14, 2006
Sold by
Federal National Mortgage Association
Bought by
Middlebrooks Allen
Current Estimated Value
Home Financials for this Owner
Home Financials are based on the most recent Mortgage that was taken out on this home.
Original Mortgage
$48,000
Interest Rate
6.64%
Mortgage Type
Purchase Money Mortgage
Purchase Details
Closed on
May 16, 2006
Sold by
Newell Joshua
Bought by
Countrywide Home Loans Inc
Purchase Details
Closed on
May 2, 2006
Sold by
Countrywide Home Loans Inc
Bought by
Federal National Mortgage Association
Purchase Details
Closed on
Mar 7, 2005
Sold by
Sivils Stephen and Sivils Samantha J
Bought by
Newell Joshua A
Home Financials for this Owner
Home Financials are based on the most recent Mortgage that was taken out on this home.
Original Mortgage
$46,350
Interest Rate
5.71%
Mortgage Type
New Conventional
Purchase Details
Closed on
Sep 12, 1996
Bought by
Sivils
Create a Home Valuation Report for This Property
The Home Valuation Report is an in-depth analysis detailing your home's value as well as a comparison with similar homes in the area
Home Values in the Area
Average Home Value in this Area
Purchase History
| Date | Buyer | Sale Price | Title Company |
|---|---|---|---|
| Middlebrooks Allen | $19,000 | -- | |
| Countrywide Home Loans Inc | $41,444 | -- | |
| Federal National Mortgage Association | -- | -- | |
| Newell Joshua A | $52,000 | -- | |
| Sivils | $38,000 | -- |
Source: Public Records
Mortgage History
| Date | Status | Borrower | Loan Amount |
|---|---|---|---|
| Closed | Middlebrooks Allen | $48,000 | |
| Previous Owner | Newell Joshua A | $46,350 |
Source: Public Records
Tax History
| Year | Tax Paid | Tax Assessment Tax Assessment Total Assessment is a certain percentage of the fair market value that is determined by local assessors to be the total taxable value of land and additions on the property. | Land | Improvement |
|---|---|---|---|---|
| 2025 | $505 | $9,109 | $1,450 | $7,659 |
| 2024 | $516 | $9,109 | $1,450 | $7,659 |
| 2023 | $505 | $9,806 | $1,450 | $8,356 |
| 2022 | $543 | $9,806 | $1,450 | $8,356 |
| 2021 | $502 | $9,070 | $1,450 | $7,620 |
| 2020 | $502 | $9,070 | $1,450 | $7,620 |
| 2019 | $502 | $9,070 | $1,450 | $7,620 |
| 2018 | $502 | $9,070 | $1,450 | $7,620 |
| 2017 | $502 | $9,070 | $1,450 | $7,620 |
| 2016 | $610 | $10,750 | $1,450 | $9,300 |
| 2015 | $603 | $10,750 | $1,450 | $9,300 |
| 2014 | $603 | $10,750 | $1,450 | $9,300 |
Source: Public Records
Map
Nearby Homes