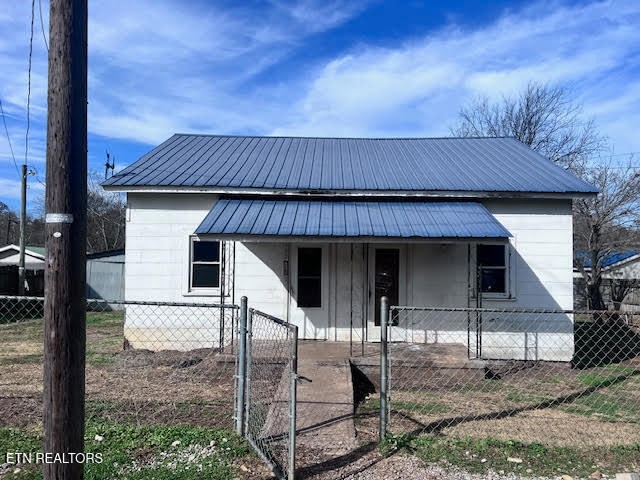
502 Thompson St Philadelphia, TN 37846
Estimated payment $470/month
Highlights
- City View
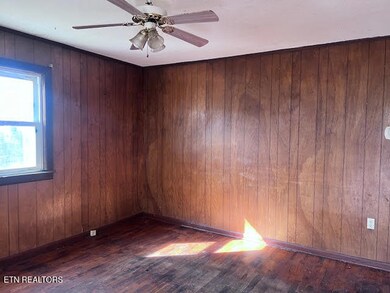
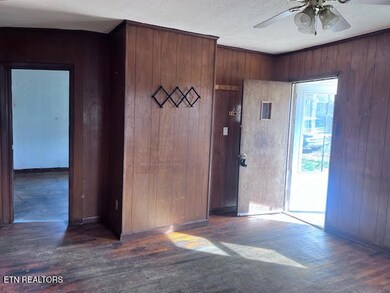
- Wood Flooring
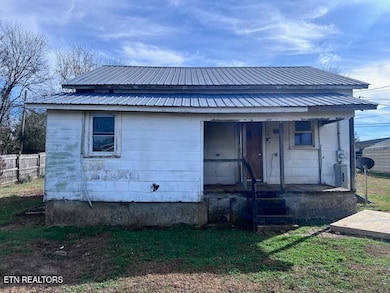
- Covered Patio or Porch
- Traditional Architecture
- No HOA
- Fenced Yard
About This Home
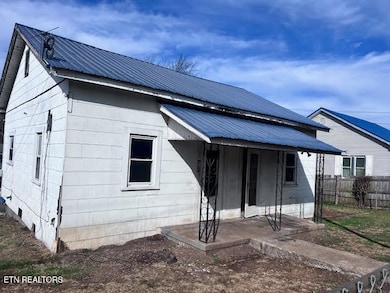
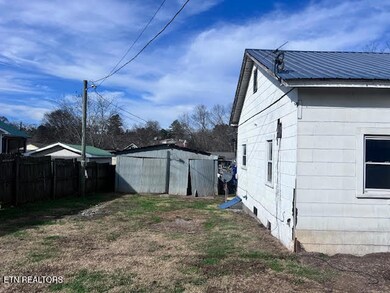
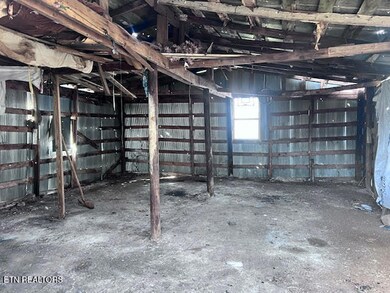
''Downtown'' Philadelphia, TN! This two-bedroom, one-bath house is a diamond in the rough, waiting for someone to unlock its potential. While it needs comprehensive renovation, this property offers excellent rental income opportunities or make it your own with a little vision & customization. The fully fenced yard provides security, while the metal roof ensures long-lasting protection. The large detached building could be used as a garage, workshop, or storage building and offers versatility for those looking for extra work space.. With nearby amenities including Lions Club Park for recreation, Food City for shopping convenience, and quality education at Loudon County Elementary & High School, this property combines investment opportunity with community appeal for the right buyer. Sold Strictly AS-IS.
Home Details
Home Type
- Single Family
Est. Annual Taxes
- $252
Year Built
- Built in 1925
Lot Details
- 6,970 Sq Ft Lot
- Lot Dimensions are 78 x 83
- Fenced Yard
- Chain Link Fence
- Level Lot
Parking
- Off-Street Parking
Home Design
- Traditional Architecture
- Frame Construction
Interior Spaces
- 840 Sq Ft Home
- Storage
- Washer and Dryer Hookup
- Wood Flooring
- City Views
- Crawl Space
- No Kitchen Appliances
Bedrooms and Bathrooms
- 2 Bedrooms
- 1 Full Bathroom
Outdoor Features
- Covered Patio or Porch
- Separate Outdoor Workshop
Utilities
- No Cooling
- Heating Available
- Septic Tank
Community Details
- No Home Owners Association
- Town Plat Of 1822 Subdivision
Listing and Financial Details
- Assessor Parcel Number 055M F 003.00
Map
Home Values in the Area
Average Home Value in this Area
Tax History
| Year | Tax Paid | Tax Assessment Tax Assessment Total Assessment is a certain percentage of the fair market value that is determined by local assessors to be the total taxable value of land and additions on the property. | Land | Improvement |
|---|---|---|---|---|
| 2025 | $216 | $14,250 | $1,250 | $13,000 |
| 2023 | $216 | $14,250 | $0 | $0 |
| 2022 | $216 | $14,250 | $1,250 | $13,000 |
| 2021 | $216 | $14,250 | $1,250 | $13,000 |
| 2020 | $167 | $14,250 | $1,250 | $13,000 |
| 2019 | $167 | $9,275 | $1,550 | $7,725 |
| 2018 | $167 | $9,275 | $1,550 | $7,725 |
| 2017 | $167 | $9,275 | $1,550 | $7,725 |
| 2016 | $187 | $10,050 | $2,150 | $7,900 |
| 2015 | $187 | $10,050 | $2,150 | $7,900 |
| 2014 | $187 | $10,050 | $2,150 | $7,900 |
Property History
| Date | Event | Price | List to Sale | Price per Sq Ft |
|---|---|---|---|---|
| 11/24/2025 11/24/25 | For Sale | $84,900 | -- | $101 / Sq Ft |
Purchase History
| Date | Type | Sale Price | Title Company |
|---|---|---|---|
| Trustee Deed | $20,500 | None Listed On Document | |
| Deed | -- | -- | |
| Deed | $38,500 | -- | |
| Warranty Deed | $38,500 | -- | |
| Deed | $19,000 | -- | |
| Warranty Deed | $23,900 | -- | |
| Warranty Deed | $18,400 | -- |
Source: East Tennessee REALTORS® MLS
MLS Number: 1322831
APN: 055M-F-003.00
Disclaimer: Certain information contained herein is derived from information provided by parties other than Homes.com. All information provided is deemed reliable, but is not guaranteed to be accurate and should be independently verified.
![]() IDX information is provided exclusively for personal, non-commercial use, and may not be used for any purpose other than to identify prospective properties consumers may be interested in purchasing. Information is deemed reliable but not guaranteed.
IDX information is provided exclusively for personal, non-commercial use, and may not be used for any purpose other than to identify prospective properties consumers may be interested in purchasing. Information is deemed reliable but not guaranteed.
Listing Information presented by local MLS brokerage: Ten-X, LLC dba Homes.com, local broker - Arlene Richardson - 888-952-6393.
- 639 Mccrary St
- 1216 Spring St
- 495 Allison Town Rd
- 0 Sunnyside Rd Unit 1316779
- 487 Julip Ln
- 7931 Dry Valley Rd
- 7944 Dry Valley Rd
- 16415 Sunnyside Rd
- 0 Ragon Rd Unit 1314465
- 850 Grimes Rd
- 11360 Roberson Springs Rd
- 154 Ragon Rd
- 960 Corinth Church Rd
- 135 Eagle Ridge Dr
- 240 Summer Glenn Ln
- 1608 Terrace Dr
- 700 Willington Place
- 494 Llewellyn Ln
- 2216 Olivia Cir
- 1 Holt Dr
- 1002 Willington Manor
- 606 Willington Manor
- 22135 Steekee Rd
- 1081 Carding MacHine Rd
- 100-228 Brown Stone Way
- 900 Mulberry St Unit 1/2
- 402 Church St
- 704 Childress Ave
- 205 Yona Way
- 318 Chatuga Ln
- 110 Chota View Ln
- 312 Paoli Trace
- 105 Cheeskogili Way
- 116 Heron Ct
- 100 Okema Cir
- 181 Brunner Rd
- 237 County Road 266
- 545 Rarity Bay Pkwy Unit 104
- 335 Flora Dr
- 2535 Highway 411
