
Seller's Agent in 2025
Stephanie Curran
Keller Williams Inspire - Geneva
(630) 816-4501
2 in this area
38 Total Sales
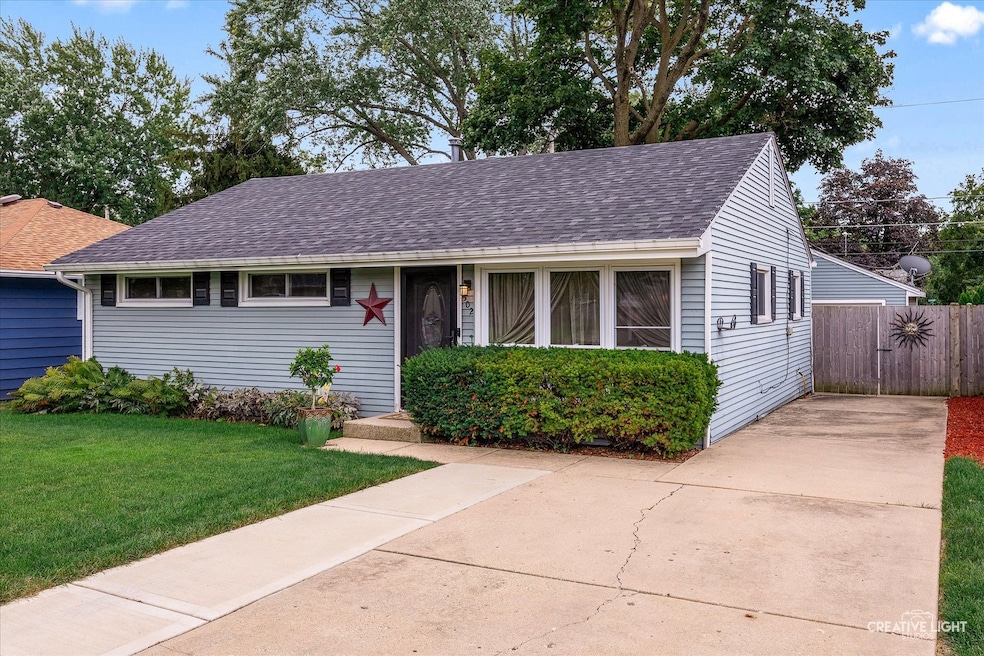


Every inch of this charming home has been updated!!!!! New flooring, new kitchen, new appliances, new bath, excellent mechanical maintaince, This owner has addressed absolutely everything. Move in ready!!!!!! Fenced in backyard. A beautiful, enchanting back yard oasis for relaxing!! Extra Wide driveway allowing side by side parking. This home has the charm and essence of St. Charles. Close to parks and schools!
Last Agent to Sell the Property
Keller Williams Inspire - Geneva License #475181062 Listed on: 08/25/2025
| Date | Type | Sale Price | Title Company |
|---|---|---|---|
| Warranty Deed | $330,000 | None Listed On Document | |
| Deed | $165,000 | Chicago Title Insurance Co | |
| Deed | $170,000 | Chicago Title Insurance Comp | |
| Warranty Deed | $132,500 | Chicago Title Insurance Co |
| Date | Status | Loan Amount | Loan Type |
|---|---|---|---|
| Open | $297,000 | New Conventional | |
| Previous Owner | $148,500 | Purchase Money Mortgage | |
| Previous Owner | $106,000 | No Value Available | |
| Closed | $13,250 | No Value Available |
| Date | Event | Price | List to Sale | Price per Sq Ft |
|---|---|---|---|---|
| 09/22/2025 09/22/25 | Sold | $330,000 | +4.8% | $308 / Sq Ft |
| 09/01/2025 09/01/25 | Pending | -- | -- | -- |
| 08/29/2025 08/29/25 | For Sale | $314,900 | 0.0% | $293 / Sq Ft |
| 08/29/2025 08/29/25 | Price Changed | $314,900 | -- | $293 / Sq Ft |
| Year | Tax Paid | Tax Assessment Tax Assessment Total Assessment is a certain percentage of the fair market value that is determined by local assessors to be the total taxable value of land and additions on the property. | Land | Improvement |
|---|---|---|---|---|
| 2024 | $5,297 | $79,360 | $27,930 | $51,430 |
| 2023 | $5,044 | $71,029 | $24,998 | $46,031 |
| 2022 | $4,763 | $64,991 | $23,980 | $41,011 |
| 2021 | $4,563 | $61,950 | $22,858 | $39,092 |
| 2020 | $4,510 | $60,795 | $22,432 | $38,363 |
| 2019 | $4,261 | $57,629 | $21,988 | $35,641 |
| 2018 | $3,994 | $54,152 | $21,151 | $33,001 |
| 2017 | $3,880 | $52,301 | $20,428 | $31,873 |
| 2016 | $4,062 | $50,465 | $19,711 | $30,754 |
| 2015 | -- | $48,875 | $19,498 | $29,377 |
| 2014 | -- | $49,877 | $19,498 | $30,379 |
| 2013 | -- | $50,927 | $19,693 | $31,234 |
Seller's Agent in 2025
Stephanie Curran
Keller Williams Inspire - Geneva
(630) 816-4501
2 in this area
38 Total Sales
Buyer's Agent in 2025
Gretchen Weber
Baird Warner
(815) 757-0617
2 in this area
147 Total Sales
Source: Midwest Real Estate Data (MRED)
MLS Number: 12455281
APN: 09-35-382-010
Disclaimer: Certain information contained herein is derived from information provided by parties other than Homes.com. All information provided is deemed reliable, but is not guaranteed to be accurate and should be independently verified.
![]() Based on information submitted to the MLS GRID. All data is obtained from various sources and may not have been verified by broker or MLS GRID. Supplied Open House Information is subject to change without notice. All information should be independently reviewed and verified for accuracy. Properties may or may not be listed by the office/agent presenting the information. Some IDX listings have been excluded from this website.
Based on information submitted to the MLS GRID. All data is obtained from various sources and may not have been verified by broker or MLS GRID. Supplied Open House Information is subject to change without notice. All information should be independently reviewed and verified for accuracy. Properties may or may not be listed by the office/agent presenting the information. Some IDX listings have been excluded from this website.
The Digital Millennium Copyright Act of 1998, 17 U.S.C. § 512 (the “DMCA”) provides recourse for copyright owners who believe that material appearing on the Internet infringes their rights under U.S. copyright law. If you believe in good faith that any content or material made available in connection with our website or services infringes your copyright, you (or your agent) may send us a notice requesting that the content or material be removed, or access to it blocked.
Notices must be sent in writing by email to DMCAnotice@MLSGrid.com.
The DMCA requires that your notice of alleged copyright infringement include the following information:
(1) description of the copyrighted work that is the subject of claimed infringement;
(2) description of the alleged infringing content and information sufficient to permit us to locate the content;
(3) contact information for you, including your address, telephone number and email address;
(4) a statement by you that you have a good faith belief that the content in the manner complained of is not authorized by the copyright owner, or its agent, or by the operation of any law;
(5) a statement by you, signed under penalty of perjury, that the information in the notification is accurate and that you have the authority to enforce the copyrights that are claimed to be infringed; and
(6) a physical or electronic signature of the copyright owner or a person authorized to act on the copyright owner’s behalf. Failure to include all of the above information may result in the delay of the processing of your complaint.