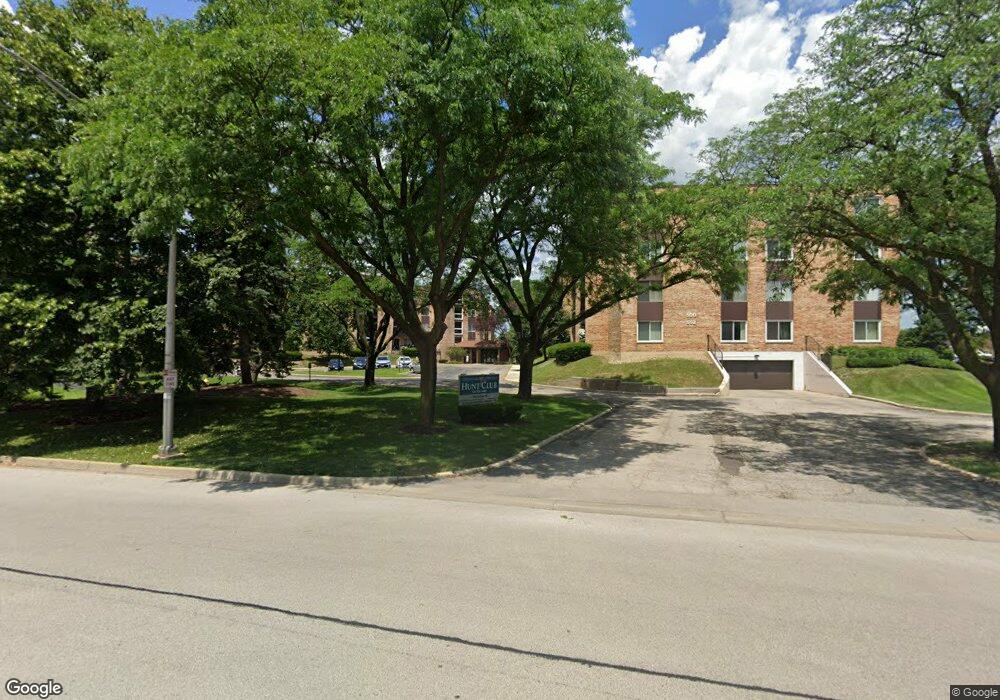
502 W Huntngtn Cmns Rd Unit 437 Mount Prospect, IL 60056
Birch Manor NeighborhoodEstimated Value: $235,867 - $257,000
2
Beds
2
Baths
1,300
Sq Ft
$187/Sq Ft
Est. Value
About This Home
This home is located at 502 W Huntngtn Cmns Rd Unit 437, Mount Prospect, IL 60056 and is currently estimated at $242,467, approximately $186 per square foot. 502 W Huntngtn Cmns Rd Unit 437 is a home located in Cook County with nearby schools including Robert Frost Elementary School, Friendship Jr High School, and Prospect High School.
Ownership History
Date
Name
Owned For
Owner Type
Purchase Details
Closed on
May 18, 2009
Sold by
Harris Nancy A
Bought by
Gueorguieva Anna and Parapitev Georgi
Current Estimated Value
Home Financials for this Owner
Home Financials are based on the most recent Mortgage that was taken out on this home.
Original Mortgage
$117,000
Outstanding Balance
$74,122
Interest Rate
4.9%
Mortgage Type
Unknown
Estimated Equity
$168,345
Purchase Details
Closed on
Nov 3, 1995
Sold by
Postol Anne M and Postol Ann
Bought by
Harris Nancy A
Purchase Details
Closed on
Feb 1, 1995
Sold by
Foglia Vincent W
Bought by
Postol Ann
Purchase Details
Closed on
Dec 15, 1994
Sold by
Foglia Vincent W
Bought by
Postel Ann
Purchase Details
Closed on
Feb 15, 1994
Sold by
Foglia Vincent W
Bought by
Postol Ann
Create a Home Valuation Report for This Property
The Home Valuation Report is an in-depth analysis detailing your home's value as well as a comparison with similar homes in the area
Home Values in the Area
Average Home Value in this Area
Purchase History
| Date | Buyer | Sale Price | Title Company |
|---|---|---|---|
| Gueorguieva Anna | $130,000 | None Available | |
| Harris Nancy A | $104,000 | -- | |
| Postol Ann | -- | -- | |
| Postel Ann | -- | -- | |
| Postol Ann | -- | -- |
Source: Public Records
Mortgage History
| Date | Status | Borrower | Loan Amount |
|---|---|---|---|
| Open | Gueorguieva Anna | $117,000 |
Source: Public Records
Tax History Compared to Growth
Tax History
| Year | Tax Paid | Tax Assessment Tax Assessment Total Assessment is a certain percentage of the fair market value that is determined by local assessors to be the total taxable value of land and additions on the property. | Land | Improvement |
|---|---|---|---|---|
| 2024 | $3,058 | $15,055 | $353 | $14,702 |
| 2023 | $2,910 | $15,055 | $353 | $14,702 |
| 2022 | $2,910 | $15,055 | $353 | $14,702 |
| 2021 | $2,681 | $12,712 | $229 | $12,483 |
| 2020 | $2,672 | $12,712 | $229 | $12,483 |
| 2019 | $2,706 | $14,139 | $229 | $13,910 |
| 2018 | $2,187 | $11,096 | $194 | $10,902 |
| 2017 | $2,211 | $11,096 | $194 | $10,902 |
| 2016 | $2,315 | $11,096 | $194 | $10,902 |
| 2015 | $2,878 | $12,593 | $158 | $12,435 |
| 2014 | $2,847 | $12,593 | $158 | $12,435 |
| 2013 | $2,763 | $12,593 | $158 | $12,435 |
Source: Public Records
Map
Nearby Homes
- 500 W Huntington Commons Rd Unit 157
- 500 W Huntington Commons Rd Unit 147
- 1024 S Hunt Club Dr
- 719 Westmere Rd
- 721 Dulles Rd Unit B
- 816 W Partridge Ln Unit 59
- 1316 S Quail Walk Unit 4
- 725 W Huntington Commons Rd Unit 217
- 905 W Palm Dr
- 1330 S Mallard Ln Unit 33
- 901 S Can Dota Ave
- 909 S We go Trail
- 720 Ambleside Rd
- 811 S Na wa ta Ave
- 1200 W Palm Dr
- 758 Dempster St Unit DG5
- 712 W Dempster St Unit FG10
- 910 Beau Dr Unit 211
- 910 Beau Dr Unit 202
- 728 Dempster St Unit 210
- 502 W Huntington Commons Rd Unit 146
- 502 W Huntington Commons Rd Unit 139
- 502 W Huntington Commons Rd Unit 138
- 502 W Huntington Commons Rd Unit 140
- 502 W Huntington Commons Rd Unit 144
- 502 W Huntington Commons Rd Unit 345
- 502 W Huntington Commons Rd Unit 340
- 502 W Huntington Commons Rd Unit 134
- 502 W Huntington Commons Rd Unit 246
- 502 W Huntngtn Cmns Rd Unit 443
- 502 W Huntngtn Cmns Rd Unit 339
- 502 W Huntngtn Cmns Rd Unit 237
- 502 W Huntngtn Cmns Rd Unit 132
- 502 W Huntngtn Cmns Rd Unit 342
- 502 W Huntngtn Cmns Rd Unit 244
- 502 W Huntngtn Cmns Rd Unit 439
- 502 W Huntngtn Cmns Rd Unit 445
- 502 W Huntngtn Cmns Rd Unit 142
- 502 W Huntngtn Cmns Rd Unit 143
- 502 W Huntngtn Cmns Rd Unit 140