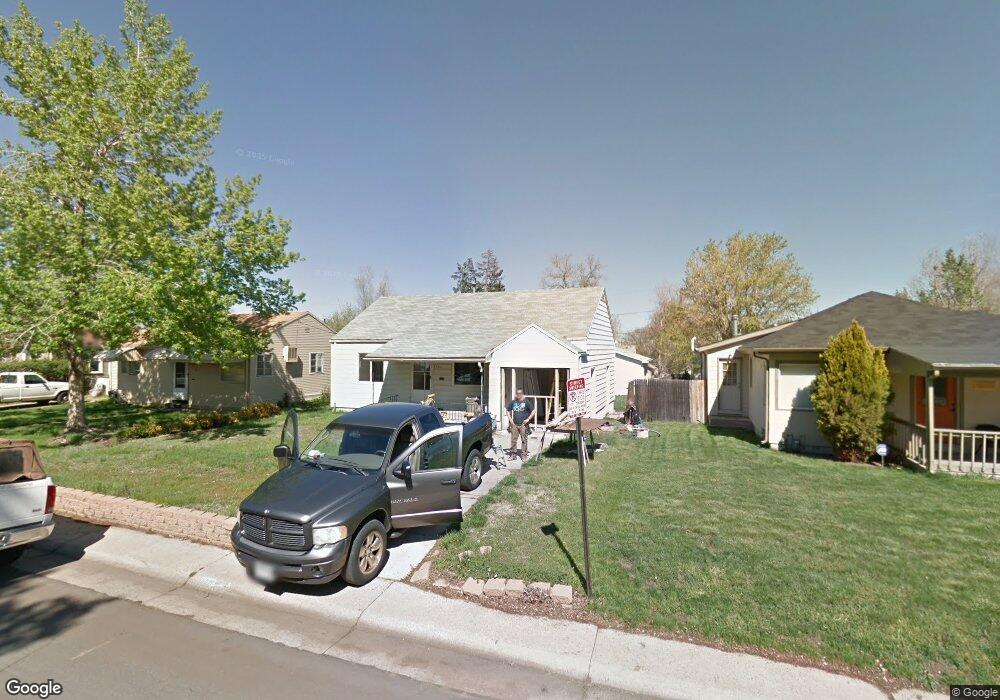
5020 Bryant St Denver, CO 80221
Chaffee Park NeighborhoodEstimated Value: $555,000 - $633,190
3
Beds
1
Bath
1,706
Sq Ft
$344/Sq Ft
Est. Value
About This Home
This home is located at 5020 Bryant St, Denver, CO 80221 and is currently estimated at $586,548, approximately $343 per square foot. 5020 Bryant St is a home located in Denver County with nearby schools including Beach Court Elementary School, Bryant Webster Dual Language School, and Denver Montessori Junior/Senior High School.
Ownership History
Date
Name
Owned For
Owner Type
Purchase Details
Closed on
Nov 9, 2017
Sold by
Kodulik David S and Kodulik Deborah Ann
Bought by
Hodulik Michelle and Mavis Anders
Current Estimated Value
Home Financials for this Owner
Home Financials are based on the most recent Mortgage that was taken out on this home.
Original Mortgage
$315,000
Outstanding Balance
$263,815
Interest Rate
3.83%
Mortgage Type
New Conventional
Estimated Equity
$322,733
Purchase Details
Closed on
Oct 29, 2015
Sold by
The Grunke Family Lllp
Bought by
Hodulik David S and Hodulik Deborah Ann
Home Financials for this Owner
Home Financials are based on the most recent Mortgage that was taken out on this home.
Original Mortgage
$221,111
Interest Rate
3.94%
Mortgage Type
New Conventional
Purchase Details
Closed on
Dec 28, 2001
Sold by
Greunke Richard L and Greunke Virginia L
Bought by
The Greunke Family Lllp
Create a Home Valuation Report for This Property
The Home Valuation Report is an in-depth analysis detailing your home's value as well as a comparison with similar homes in the area
Home Values in the Area
Average Home Value in this Area
Purchase History
| Date | Buyer | Sale Price | Title Company |
|---|---|---|---|
| Hodulik Michelle | $350,000 | Land Title Guarantee Co | |
| Hodulik David S | $294,815 | Land Title Guarantee | |
| The Greunke Family Lllp | -- | -- |
Source: Public Records
Mortgage History
| Date | Status | Borrower | Loan Amount |
|---|---|---|---|
| Open | Hodulik Michelle | $315,000 | |
| Previous Owner | Hodulik David S | $221,111 |
Source: Public Records
Tax History Compared to Growth
Tax History
| Year | Tax Paid | Tax Assessment Tax Assessment Total Assessment is a certain percentage of the fair market value that is determined by local assessors to be the total taxable value of land and additions on the property. | Land | Improvement |
|---|---|---|---|---|
| 2024 | $3,407 | $43,020 | $13,060 | $29,960 |
| 2023 | $3,333 | $43,020 | $13,060 | $29,960 |
| 2022 | $2,531 | $31,830 | $13,020 | $18,810 |
| 2021 | $2,444 | $32,750 | $13,400 | $19,350 |
| 2020 | $2,179 | $29,370 | $13,400 | $15,970 |
| 2019 | $1,995 | $27,670 | $13,400 | $14,270 |
| 2018 | $1,834 | $23,710 | $6,750 | $16,960 |
| 2017 | $1,829 | $23,710 | $6,750 | $16,960 |
| 2016 | $1,323 | $16,220 | $2,985 | $13,235 |
| 2015 | $1,267 | $16,220 | $2,985 | $13,235 |
| 2014 | $1,080 | $13,000 | $3,041 | $9,959 |
Source: Public Records
Map
Nearby Homes
- 4901 Bryant St
- 5152 Bryant St
- 4869 Clay St
- 5185 Alcott St
- 4888 Elm Ct
- 2541 W 52nd Ave
- 2851 W 52nd Ave Unit 404
- 5230 Zuni St
- 2835 W Parkside Place Unit 305
- 4775 Decatur St
- 2869 W Parkside Place
- 5227 N Eliot St
- 2876 W 53rd Ave Unit 111
- 2876 W 53rd Ave Unit 301
- 2876 W 53rd Ave Unit 106
- 4752 Eliot St
- 4856 Umatilla St
- 4721 Elm Ct
- 4804 Umatilla St
- 4647 Bryant St