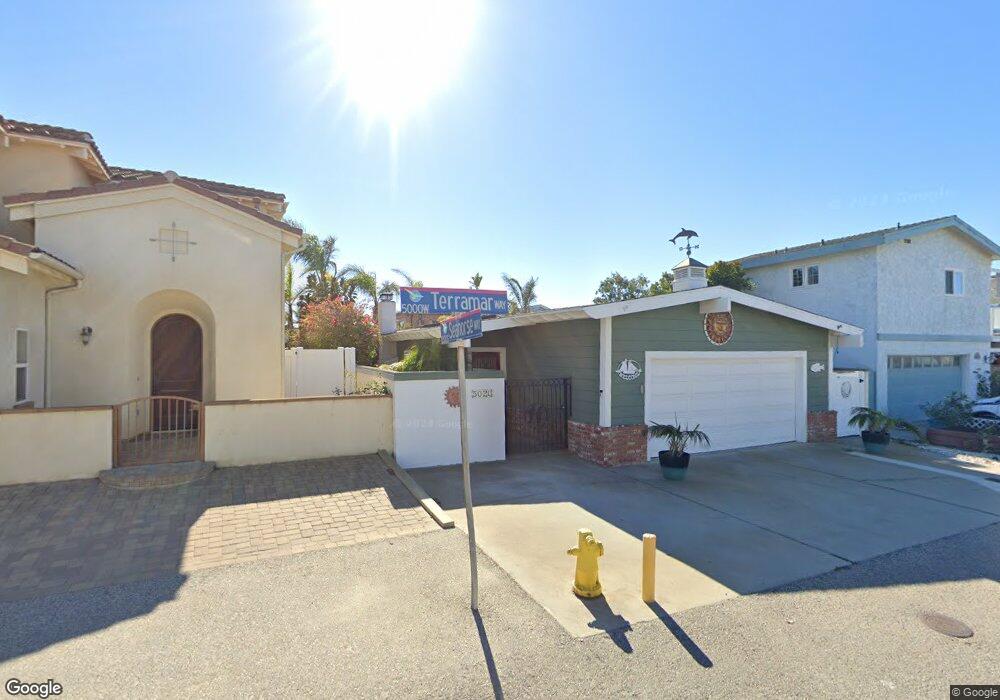
5020 Terramar Way Oxnard, CA 93035
Oxnard Shores NeighborhoodEstimated Value: $1,212,000 - $1,422,000
3
Beds
2
Baths
1,503
Sq Ft
$871/Sq Ft
Est. Value
About This Home
This home is located at 5020 Terramar Way, Oxnard, CA 93035 and is currently estimated at $1,309,531, approximately $871 per square foot. 5020 Terramar Way is a home located in Ventura County with nearby schools including Christa Mcauliffe Elementary School and Oxnard High School.
Ownership History
Date
Name
Owned For
Owner Type
Purchase Details
Closed on
May 2, 2012
Sold by
Logan John and Logan Lisa
Bought by
Thorpe Timothy A and Thorpe Merry M
Current Estimated Value
Home Financials for this Owner
Home Financials are based on the most recent Mortgage that was taken out on this home.
Original Mortgage
$387,200
Outstanding Balance
$267,641
Interest Rate
3.85%
Mortgage Type
New Conventional
Estimated Equity
$1,041,890
Purchase Details
Closed on
Jul 23, 2004
Sold by
Boylan Daniel M and Boylan Karen A
Bought by
Logan John and Logan Lisa
Home Financials for this Owner
Home Financials are based on the most recent Mortgage that was taken out on this home.
Original Mortgage
$500,000
Interest Rate
5.76%
Mortgage Type
Purchase Money Mortgage
Purchase Details
Closed on
Sep 18, 2001
Sold by
Ashley Ronald A and Ashley Sheila J
Bought by
Boylan Daniel M and Boylan Karen A
Home Financials for this Owner
Home Financials are based on the most recent Mortgage that was taken out on this home.
Original Mortgage
$275,000
Interest Rate
6.87%
Create a Home Valuation Report for This Property
The Home Valuation Report is an in-depth analysis detailing your home's value as well as a comparison with similar homes in the area
Home Values in the Area
Average Home Value in this Area
Purchase History
| Date | Buyer | Sale Price | Title Company |
|---|---|---|---|
| Thorpe Timothy A | $484,000 | Chicago Title Company | |
| Logan John | $715,000 | Chicago Title Company | |
| Boylan Daniel M | $370,000 | First American Title Ins Co |
Source: Public Records
Mortgage History
| Date | Status | Borrower | Loan Amount |
|---|---|---|---|
| Open | Thorpe Timothy A | $387,200 | |
| Previous Owner | Logan John | $500,000 | |
| Previous Owner | Boylan Daniel M | $275,000 | |
| Closed | Boylan Daniel M | $20,900 |
Source: Public Records
Tax History Compared to Growth
Tax History
| Year | Tax Paid | Tax Assessment Tax Assessment Total Assessment is a certain percentage of the fair market value that is determined by local assessors to be the total taxable value of land and additions on the property. | Land | Improvement |
|---|---|---|---|---|
| 2025 | $7,282 | $607,917 | $427,055 | $180,862 |
| 2024 | $7,282 | $595,998 | $418,682 | $177,316 |
| 2023 | $7,014 | $584,312 | $410,472 | $173,840 |
| 2022 | $6,801 | $572,855 | $402,423 | $170,432 |
| 2021 | $6,745 | $561,623 | $394,532 | $167,091 |
| 2020 | $6,870 | $555,867 | $390,488 | $165,379 |
| 2019 | $6,674 | $544,969 | $382,832 | $162,137 |
| 2018 | $6,579 | $534,284 | $375,326 | $158,958 |
| 2017 | $6,241 | $523,809 | $367,967 | $155,842 |
| 2016 | $6,021 | $513,539 | $360,752 | $152,787 |
| 2015 | $6,084 | $505,827 | $355,334 | $150,493 |
| 2014 | $6,033 | $495,920 | $348,374 | $147,546 |
Source: Public Records
Map
Nearby Homes
- 1230 Mandalay Beach Rd
- 5125 W Wooley Rd Unit 5
- 5121 Breakwater Way
- 4940 Dunes St
- 1410 Marine Way
- 1235 Capri Way
- 4906 Dunes St
- 1211 Capri Way
- 1135 Capri Way
- 1417 Marine Way
- 1020 Dunes St
- 5113 Whitecap St
- 5244 Whitecap St
- 1068 Canal St
- 911 Dunes St
- 4911 Oceanaire St
- 920 Catamaran St
- 4844 Oceanaire St
- 5245 Seabreeze Way
- 5331 Wavecrest Way
- 5024 Terramar Way
- 5012 Terramar Way
- 5030 Terramar Way
- 5010 Terramar Way
- 5039 Sealane Way
- 5045 Sealane Way
- 5033 Sealane Way
- 5034 Terramar Way
- 5051 Sealane Way
- 1151 Seahorse Way
- 5007 Terramar Way
- 5008 Terramar Way
- 5027 Terramar Way
- 5027 Sealane Way
- 5057 Sealane Way
- 5033 Terramar Way
- 5005 Terramar Way
- 5021 Sealane Way
- 5002 Terramar Way
- 5065 Sealane Way