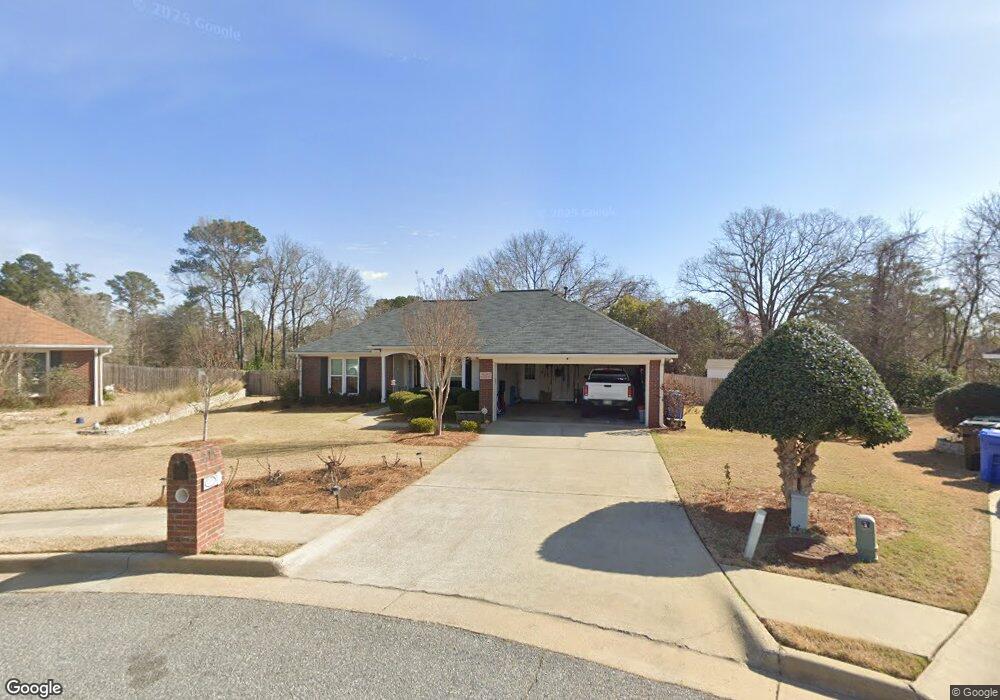
5021 Emerald Isle Ct Columbus, GA 31909
Northern Columbus NeighborhoodEstimated Value: $275,729 - $310,000
3
Beds
2
Baths
1,722
Sq Ft
$173/Sq Ft
Est. Value
About This Home
This home is located at 5021 Emerald Isle Ct, Columbus, GA 31909 and is currently estimated at $298,432, approximately $173 per square foot. 5021 Emerald Isle Ct is a home located in Muscogee County with nearby schools including Blanchard Elementary School, Blackmon Road Middle School, and Shaw High School.
Ownership History
Date
Name
Owned For
Owner Type
Purchase Details
Closed on
Feb 28, 2018
Sold by
Hague Ehtesham U
Bought by
Hicks Paul A and Anna I Mion I
Current Estimated Value
Home Financials for this Owner
Home Financials are based on the most recent Mortgage that was taken out on this home.
Original Mortgage
$165,000
Outstanding Balance
$140,852
Interest Rate
4.22%
Mortgage Type
New Conventional
Estimated Equity
$157,580
Purchase Details
Closed on
Aug 28, 2009
Sold by
Haque Angie R
Bought by
Haque Angie R and Haque Ehtesham U
Home Financials for this Owner
Home Financials are based on the most recent Mortgage that was taken out on this home.
Original Mortgage
$192,449
Interest Rate
5.14%
Mortgage Type
FHA
Purchase Details
Closed on
Aug 4, 2009
Sold by
Gower Peggy Crawford
Bought by
Haque Angie R
Home Financials for this Owner
Home Financials are based on the most recent Mortgage that was taken out on this home.
Original Mortgage
$192,449
Interest Rate
5.14%
Mortgage Type
FHA
Create a Home Valuation Report for This Property
The Home Valuation Report is an in-depth analysis detailing your home's value as well as a comparison with similar homes in the area
Home Values in the Area
Average Home Value in this Area
Purchase History
| Date | Buyer | Sale Price | Title Company |
|---|---|---|---|
| Hicks Paul A | $195,000 | -- | |
| Haque Angie R | -- | None Available | |
| Haque Angie R | $196,000 | None Available |
Source: Public Records
Mortgage History
| Date | Status | Borrower | Loan Amount |
|---|---|---|---|
| Open | Hicks Paul A | $165,000 | |
| Previous Owner | Haque Angie R | $192,449 |
Source: Public Records
Tax History Compared to Growth
Tax History
| Year | Tax Paid | Tax Assessment Tax Assessment Total Assessment is a certain percentage of the fair market value that is determined by local assessors to be the total taxable value of land and additions on the property. | Land | Improvement |
|---|---|---|---|---|
| 2025 | $2,382 | $84,520 | $16,520 | $68,000 |
| 2024 | $2,381 | $84,520 | $16,520 | $68,000 |
| 2023 | $1,701 | $84,520 | $16,520 | $68,000 |
| 2022 | $2,483 | $74,140 | $16,520 | $57,620 |
| 2021 | $2,436 | $73,160 | $16,520 | $56,640 |
| 2020 | $2,437 | $73,048 | $16,520 | $56,528 |
| 2019 | $2,446 | $73,048 | $16,520 | $56,528 |
| 2018 | $2,993 | $73,048 | $16,520 | $56,528 |
| 2017 | $3,002 | $73,048 | $16,520 | $56,528 |
| 2016 | $3,280 | $79,519 | $11,600 | $67,919 |
| 2015 | $3,284 | $79,519 | $11,600 | $67,919 |
| 2014 | $2,740 | $79,519 | $11,600 | $67,919 |
| 2013 | -- | $79,519 | $11,600 | $67,919 |
Source: Public Records
Map
Nearby Homes
- 4417 Sibley St
- 4245 N Oaks Dr
- 6717 Moon Cir
- 6736 Charter Oaks Cir
- 4627 Wimbish Ct
- 4715 Teak Dr
- 6500 Charter Oaks Cir
- 3919 Gray Fox Dr
- 6630 Lemans Ln
- 4454 Weems Rd
- 4202 Cheshire Bridge Rd
- 6813 Panstone Dr
- 6136 Morningside Dr
- 5011 Montego Dr
- 22 Nettle Ct
- 6158 Arrington Dr
- 5041 Montego Dr
- 3824 Lyn Dr
- 6104 Candlestick Loop
- 2 Nightwind Ct
- 5019 Emerald Isle Ct
- 4435 Greenridge Dr
- 4429 Greenridge Dr
- 4441 Greenridge Dr
- 5022 Emerald Isle Ct
- 5017 Emerald Isle Ct
- 4378 White Clover Trail
- 4423 Greenridge Dr
- 4447 Greenridge Dr
- 5020 Emerald Isle Ct
- 4372 White Clover Trail
- 4417 Greenridge Dr
- 5013 Emerald Isle Ct
- 5018 Emerald Isle Ct
- 4453 Greenridge Dr
- 4377 White Clover Trail
- 4366 White Clover Trail
- 4432 Greenridge Dr
- 5014 Emerald Isle Ct
- 4438 Greenridge Dr