J
Seller's Agent in 2021
John Byrne
Govberg Realty LLC
Estimated Value: $200,000 - $272,631
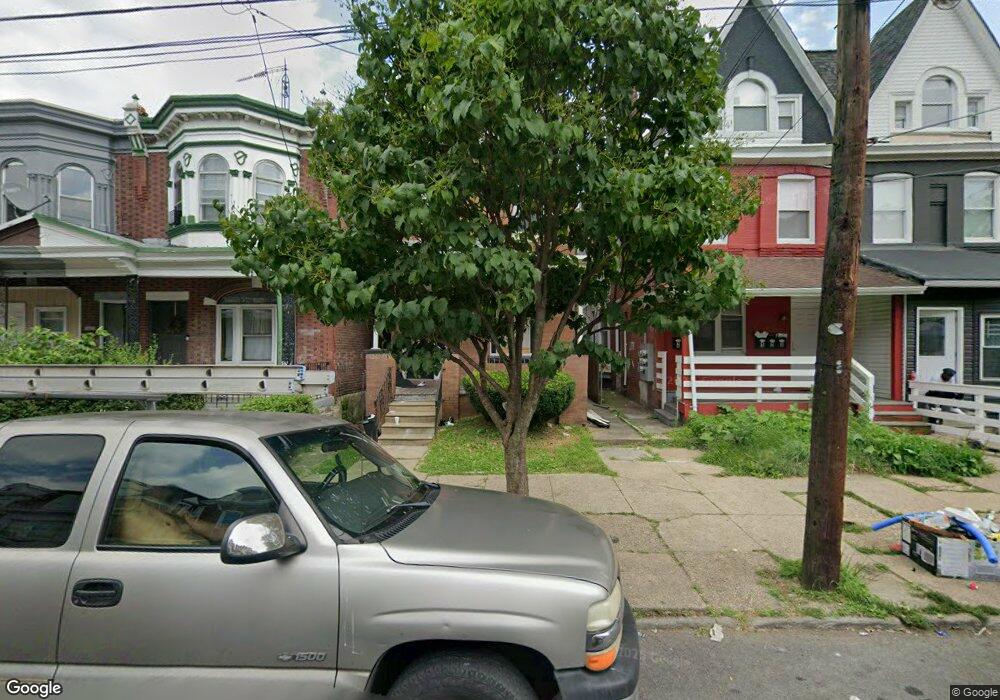
This home is located at 5021 Griscom St, Philadelphia, PA 19124 and is currently estimated at $235,158, approximately $120 per square foot. 5021 Griscom St is a home located in Philadelphia County with nearby schools including Frankford High School, The Philadelphia Charter School for the Arts & Sciences, and Maritime Academy.
| Date | Buyer | Sale Price | Title Company |
|---|---|---|---|
| Jones Charles Frederick | $150,000 | Chase Abstract Company | |
| 5021 Griscom Llc | $137,000 | Knights Abstract Inc |
| Date | Status | Borrower | Loan Amount |
|---|---|---|---|
| Open | Jones Charles Frederick | $112,500 | |
| Previous Owner | 5021 Griscom Llc | $109,600 |
| Date | Event | Price | List to Sale | Price per Sq Ft | Prior Sale |
|---|---|---|---|---|---|
| 01/15/2021 01/15/21 | Sold | $150,000 | 0.0% | $77 / Sq Ft | View Prior Sale |
| 01/15/2021 01/15/21 | Sold | $150,000 | -14.3% | $77 / Sq Ft | View Prior Sale |
| 12/16/2020 12/16/20 | Pending | -- | -- | -- | |
| 12/16/2020 12/16/20 | For Sale | $175,000 | 0.0% | $90 / Sq Ft | |
| 12/16/2020 12/16/20 | Pending | -- | -- | -- | |
| 10/14/2020 10/14/20 | For Sale | $175,000 | +27.7% | $90 / Sq Ft | |
| 04/10/2017 04/10/17 | Sold | $137,000 | 0.0% | $70 / Sq Ft | View Prior Sale |
| 02/21/2017 02/21/17 | Pending | -- | -- | -- | |
| 01/20/2017 01/20/17 | For Sale | $137,000 | -13.8% | $70 / Sq Ft | |
| 01/10/2013 01/10/13 | Sold | $159,000 | -5.9% | $82 / Sq Ft | View Prior Sale |
| 12/11/2012 12/11/12 | Pending | -- | -- | -- | |
| 10/20/2012 10/20/12 | For Sale | $169,000 | -- | $87 / Sq Ft |
| Year | Tax Paid | Tax Assessment Tax Assessment Total Assessment is a certain percentage of the fair market value that is determined by local assessors to be the total taxable value of land and additions on the property. | Land | Improvement |
|---|---|---|---|---|
| 2026 | $2,818 | $245,700 | $49,140 | $196,560 |
| 2025 | $2,818 | $245,700 | $49,140 | $196,560 |
| 2024 | $2,818 | $245,700 | $49,140 | $196,560 |
| 2023 | $2,818 | $201,300 | $40,260 | $161,040 |
| 2022 | $1,926 | $201,300 | $40,260 | $161,040 |
| 2021 | $1,926 | $0 | $0 | $0 |
| 2020 | $1,926 | $0 | $0 | $0 |
| 2019 | $1,848 | $0 | $0 | $0 |
| 2018 | $1,853 | $0 | $0 | $0 |
| 2017 | $1,853 | $0 | $0 | $0 |
| 2016 | $1,853 | $0 | $0 | $0 |
| 2015 | $1,774 | $0 | $0 | $0 |
| 2014 | -- | $132,400 | $26,600 | $105,800 |
| 2012 | -- | $11,264 | $1,454 | $9,810 |
J
Seller's Agent in 2021
John Byrne
Govberg Realty LLC

Buyer's Agent in 2021
Shawn Washington
Keller Williams Main Line
(610) 766-1682
2 in this area
21 Total Sales
C
Seller's Agent in 2017
Crystal Ly
Keller Williams Real Estate Tri-County
Seller's Agent in 2013
Michael Cohen
KW Empower
(610) 331-7213
37 in this area
851 Total Sales
Seller Co-Listing Agent in 2013
Rachel Gorelick
HG Realty Services, Ltd.
(267) 475-5925
11 Total Sales
Buyer's Agent in 2013
Lisa Risco
Keller Williams Main Line
(215) 768-8065
3 in this area
173 Total Sales