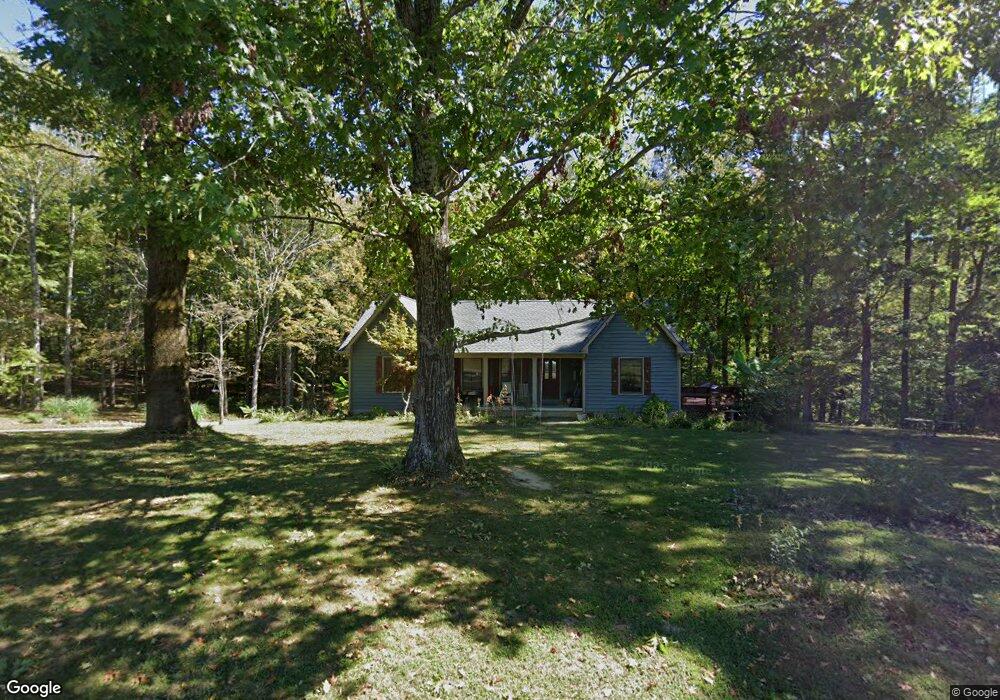
5021 Mason Valley Rd Cookeville, TN 38506
Estimated Value: $444,000 - $472,000
4
Beds
3
Baths
2,866
Sq Ft
$160/Sq Ft
Est. Value
About This Home
This home is located at 5021 Mason Valley Rd, Cookeville, TN 38506 and is currently estimated at $458,576, approximately $160 per square foot. 5021 Mason Valley Rd is a home located in Putnam County with nearby schools including Cookeville High School, Algood Middle School, and Northeast Elementary School.
Ownership History
Date
Name
Owned For
Owner Type
Purchase Details
Closed on
Dec 10, 2015
Sold by
Bailey Crystal J
Bought by
Drew Timothy A Natnicha Suan
Current Estimated Value
Home Financials for this Owner
Home Financials are based on the most recent Mortgage that was taken out on this home.
Original Mortgage
$56,000
Outstanding Balance
$7,218
Interest Rate
4.01%
Mortgage Type
New Conventional
Estimated Equity
$451,358
Purchase Details
Closed on
Sep 18, 2008
Sold by
Lewis Greg W
Bought by
Bailey Crystal J
Home Financials for this Owner
Home Financials are based on the most recent Mortgage that was taken out on this home.
Original Mortgage
$178,149
Interest Rate
6.45%
Purchase Details
Closed on
Dec 10, 2001
Sold by
Mike Copeland and Mike Rita
Bought by
Lewis Greg W
Purchase Details
Closed on
Nov 14, 1988
Bought by
Copeland Mike and Copeland Rita
Create a Home Valuation Report for This Property
The Home Valuation Report is an in-depth analysis detailing your home's value as well as a comparison with similar homes in the area
Home Values in the Area
Average Home Value in this Area
Purchase History
| Date | Buyer | Sale Price | Title Company |
|---|---|---|---|
| Drew Timothy A Natnicha Suan | $215,000 | -- | |
| Bailey Crystal J | $180,000 | -- | |
| Lewis Greg W | $122,000 | -- | |
| Copeland Mike | $7,500 | -- |
Source: Public Records
Mortgage History
| Date | Status | Borrower | Loan Amount |
|---|---|---|---|
| Open | Drew Timothy A Natnicha Suan | $56,000 | |
| Previous Owner | Copeland Mike | $178,149 |
Source: Public Records
Tax History Compared to Growth
Tax History
| Year | Tax Paid | Tax Assessment Tax Assessment Total Assessment is a certain percentage of the fair market value that is determined by local assessors to be the total taxable value of land and additions on the property. | Land | Improvement |
|---|---|---|---|---|
| 2024 | $1,722 | $64,725 | $4,475 | $60,250 |
| 2023 | $1,722 | $64,725 | $4,475 | $60,250 |
| 2022 | $1,600 | $64,725 | $4,475 | $60,250 |
| 2021 | $1,600 | $64,725 | $4,475 | $60,250 |
| 2020 | $1,421 | $64,725 | $4,475 | $60,250 |
| 2019 | $1,421 | $48,550 | $3,475 | $45,075 |
| 2018 | $1,325 | $48,550 | $3,475 | $45,075 |
| 2017 | $1,325 | $48,550 | $3,475 | $45,075 |
| 2016 | $1,325 | $48,550 | $3,475 | $45,075 |
| 2015 | $1,362 | $48,550 | $3,475 | $45,075 |
| 2014 | $889 | $31,683 | $0 | $0 |
Source: Public Records
Map
Nearby Homes
- 5055 Mason Valley Rd
- 5000 Penthouse Rd
- 4952 Penthouse Rd
- 4898 Village Rd
- 5060 Mason Valley Rd
- 4985 N Penthouse Dr
- 426 Mahan Rd
- 4920 Penthouse Rd
- 4993 Penthouse Rd
- 4950 Village Rd
- 4970 Village Rd
- 4931 Penthouse Rd
- 4998 Village Rd
- 4860 Village Rd
- 4899 Village Rd
- 5023 Penthouse Rd
- 4925 Penthouse Rd
- 4885 Village Rd
- 5000 Village Rd
- 5001 Penthouse Rd