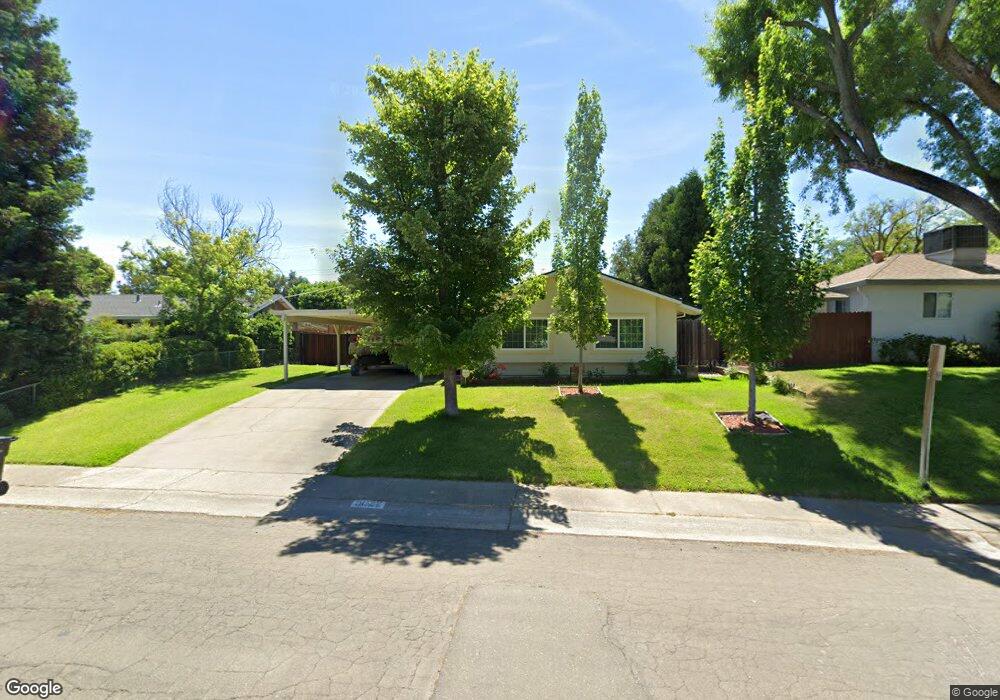
5022 Oleander Dr Carmichael, CA 95608
Estimated Value: $443,000 - $508,000
3
Beds
2
Baths
1,176
Sq Ft
$405/Sq Ft
Est. Value
About This Home
This home is located at 5022 Oleander Dr, Carmichael, CA 95608 and is currently estimated at $475,868, approximately $404 per square foot. 5022 Oleander Dr is a home located in Sacramento County with nearby schools including Charles Peck Elementary School, Will Rogers Middle School, and Del Campo High School.
Ownership History
Date
Name
Owned For
Owner Type
Purchase Details
Closed on
Mar 20, 2013
Sold by
Rajak Branko and Rajak Asima
Bought by
Rajak Branko and Rajak Asima
Current Estimated Value
Purchase Details
Closed on
May 31, 2011
Sold by
Rajak Asima
Bought by
Rajak Asima and Rajak Branko
Purchase Details
Closed on
Nov 19, 2010
Sold by
Rajak Branko
Bought by
Rajak Asima
Home Financials for this Owner
Home Financials are based on the most recent Mortgage that was taken out on this home.
Original Mortgage
$156,000
Outstanding Balance
$102,716
Interest Rate
4.23%
Mortgage Type
New Conventional
Estimated Equity
$373,152
Purchase Details
Closed on
Aug 14, 2008
Sold by
Eidem Mark C and Eidem Joann
Bought by
Eidem Mark C and Eidem Joann
Create a Home Valuation Report for This Property
The Home Valuation Report is an in-depth analysis detailing your home's value as well as a comparison with similar homes in the area
Home Values in the Area
Average Home Value in this Area
Purchase History
| Date | Buyer | Sale Price | Title Company |
|---|---|---|---|
| Rajak Branko | -- | None Available | |
| Rajak Asima | -- | None Available | |
| Rajak Asima | -- | Chicago Title Company | |
| Rajak Asima | $195,000 | Chicago Title Company | |
| Eidem Mark C | -- | None Available | |
| Eidem Mark C | -- | None Available |
Source: Public Records
Mortgage History
| Date | Status | Borrower | Loan Amount |
|---|---|---|---|
| Open | Rajak Asima | $156,000 |
Source: Public Records
Tax History
| Year | Tax Paid | Tax Assessment Tax Assessment Total Assessment is a certain percentage of the fair market value that is determined by local assessors to be the total taxable value of land and additions on the property. | Land | Improvement |
|---|---|---|---|---|
| 2025 | $2,883 | $249,817 | $161,424 | $88,393 |
| 2024 | $2,883 | $244,919 | $158,259 | $86,660 |
| 2023 | $2,835 | $240,117 | $155,156 | $84,961 |
| 2022 | $2,777 | $235,410 | $152,114 | $83,296 |
| 2021 | $2,730 | $230,795 | $149,132 | $81,663 |
| 2020 | $2,678 | $228,429 | $147,603 | $80,826 |
| 2019 | $2,623 | $223,951 | $144,709 | $79,242 |
| 2018 | $2,591 | $219,561 | $141,872 | $77,689 |
| 2017 | $2,564 | $215,257 | $139,091 | $76,166 |
| 2016 | $2,393 | $211,037 | $136,364 | $74,673 |
| 2015 | $2,396 | $207,868 | $134,316 | $73,552 |
| 2014 | $2,346 | $203,797 | $131,685 | $72,112 |
Source: Public Records
Map
Nearby Homes
- 4952 Oleander Dr
- 6636 Saint James Dr
- 6430 Sandstone St
- 6319 Saint James Dr
- 4970 Hillhurst Dr
- 5262 Flagstone St
- 5220 Lynnadeane Ct
- 6705 Palmtree Ct
- 5334 Agate Way
- 4701 Pedersen Way
- 6824 Will Rogers Dr
- 4907 Crestview Dr
- 5106 Mckinney Way
- 5009 Waterbury Way
- 6211 Longmont Way
- 6123 Longmont Way
- 4823 Schuyler Dr
- 6810 Rappahannock Way
- 6441 Rexford Way
- 5417 Edgerly Way
- 5028 Oleander Dr
- 5016 Alan Ct
- 5014 Alan Ct
- 5031 Robander St
- 5025 Robander St
- 5034 Oleander Dr
- 5037 Robander St
- 5019 Robander St
- 5012 Alan Ct
- 5023 Oleander Dr
- 5017 Oleander Dr
- 5100 Oleander Dr
- 5043 Robander St
- 5013 Robander St
- 5010 Alan Ct
- 5062 Patti Jo Dr
- 5006 Alan Ct
- 5008 Alan Ct
- 5101 Oleander Dr
- 5107 Kipp Way
Your Personal Tour Guide
Ask me questions while you tour the home.