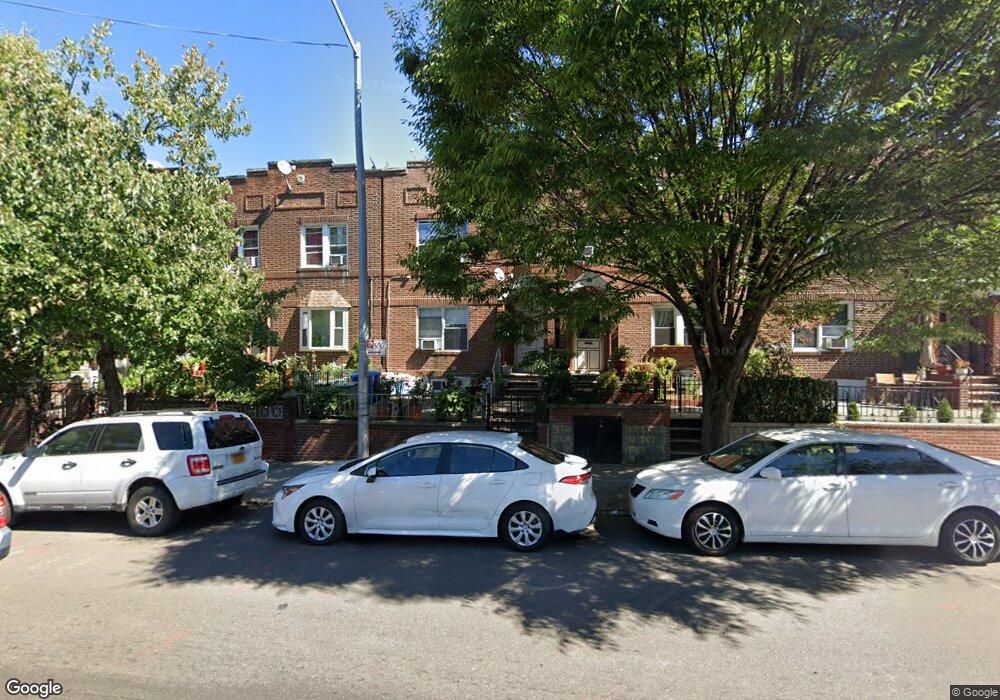
5023 48th St Woodside, NY 11377
Sunnyside NeighborhoodEstimated Value: $1,062,234 - $1,128,000
--
Bed
--
Bath
1,596
Sq Ft
$682/Sq Ft
Est. Value
About This Home
This home is located at 5023 48th St, Woodside, NY 11377 and is currently estimated at $1,087,809, approximately $681 per square foot. 5023 48th St is a home located in Queens County with nearby schools including P.S. 199 Maurice A Fitzgerald, William Cullen Bryant High School, and Razi School.
Ownership History
Date
Name
Owned For
Owner Type
Purchase Details
Closed on
Mar 28, 2002
Sold by
Rodriguez Gloria and Rodriquez Cecilio L
Bought by
Rana Taslima
Current Estimated Value
Home Financials for this Owner
Home Financials are based on the most recent Mortgage that was taken out on this home.
Original Mortgage
$414,200
Interest Rate
7%
Mortgage Type
Purchase Money Mortgage
Purchase Details
Closed on
Jul 7, 2000
Sold by
Romero Jose and Pelaez Carlos
Bought by
Rodriguez Gloria and Rodriguez Cecilio L
Home Financials for this Owner
Home Financials are based on the most recent Mortgage that was taken out on this home.
Original Mortgage
$297,000
Interest Rate
8.18%
Purchase Details
Closed on
Sep 21, 1999
Sold by
Rudin Daniel C and Rudin Debra
Bought by
Romero Jose and Pelaez Carlos
Home Financials for this Owner
Home Financials are based on the most recent Mortgage that was taken out on this home.
Original Mortgage
$247,500
Interest Rate
7.77%
Create a Home Valuation Report for This Property
The Home Valuation Report is an in-depth analysis detailing your home's value as well as a comparison with similar homes in the area
Home Values in the Area
Average Home Value in this Area
Purchase History
| Date | Buyer | Sale Price | Title Company |
|---|---|---|---|
| Rana Taslima | -- | -- | |
| Rana Taslima | -- | -- | |
| Rodriguez Gloria | $330,000 | -- | |
| Rodriguez Gloria | $330,000 | -- | |
| Romero Jose | $275,000 | -- | |
| Romero Jose | $275,000 | -- |
Source: Public Records
Mortgage History
| Date | Status | Borrower | Loan Amount |
|---|---|---|---|
| Previous Owner | Rana Taslima | $414,200 | |
| Previous Owner | Rodriguez Gloria | $297,000 | |
| Previous Owner | Romero Jose | $247,500 |
Source: Public Records
Tax History Compared to Growth
Tax History
| Year | Tax Paid | Tax Assessment Tax Assessment Total Assessment is a certain percentage of the fair market value that is determined by local assessors to be the total taxable value of land and additions on the property. | Land | Improvement |
|---|---|---|---|---|
| 2025 | $8,474 | $44,191 | $7,416 | $36,775 |
| 2024 | $8,486 | $43,592 | $7,640 | $35,952 |
| 2023 | $8,254 | $42,494 | $7,174 | $35,320 |
| 2022 | $7,716 | $58,560 | $10,200 | $48,360 |
| 2021 | $7,919 | $60,360 | $10,200 | $50,160 |
| 2020 | $7,499 | $59,340 | $10,200 | $49,140 |
| 2019 | $7,306 | $50,820 | $10,200 | $40,620 |
| 2018 | $6,921 | $35,412 | $10,101 | $25,311 |
| 2017 | $6,511 | $33,408 | $8,515 | $24,893 |
| 2016 | $6,193 | $33,408 | $8,515 | $24,893 |
| 2015 | $3,581 | $30,688 | $8,286 | $22,402 |
| 2014 | $3,581 | $30,273 | $9,632 | $20,641 |
Source: Public Records
Map
Nearby Homes
- 50-43 48th St
- 50-56 47th St
- 50-05 46th St
- 51-17 47th St Unit 2
- 48-41 45th St
- 48-50 44th St Unit 4E
- 48-56 44th St Unit 2H
- 48-55 43rd St Unit 4H
- 5068 43rd St
- 48-19 43rd St Unit 4D
- 4310 48th Ave Unit 2A
- 4310 48th Ave Unit 2F
- 43-10 48th Ave Unit 2A
- 43-10 48th Ave Unit 2P
- 43-10 48th Ave Unit . 2J
- 48-17 42nd St Unit 2C
- 48-17 42nd St Unit 7B
- 48-41 43rd St Unit 5F
- 48-23 42nd St Unit 1 J
- 48-01 42nd St Unit 5D