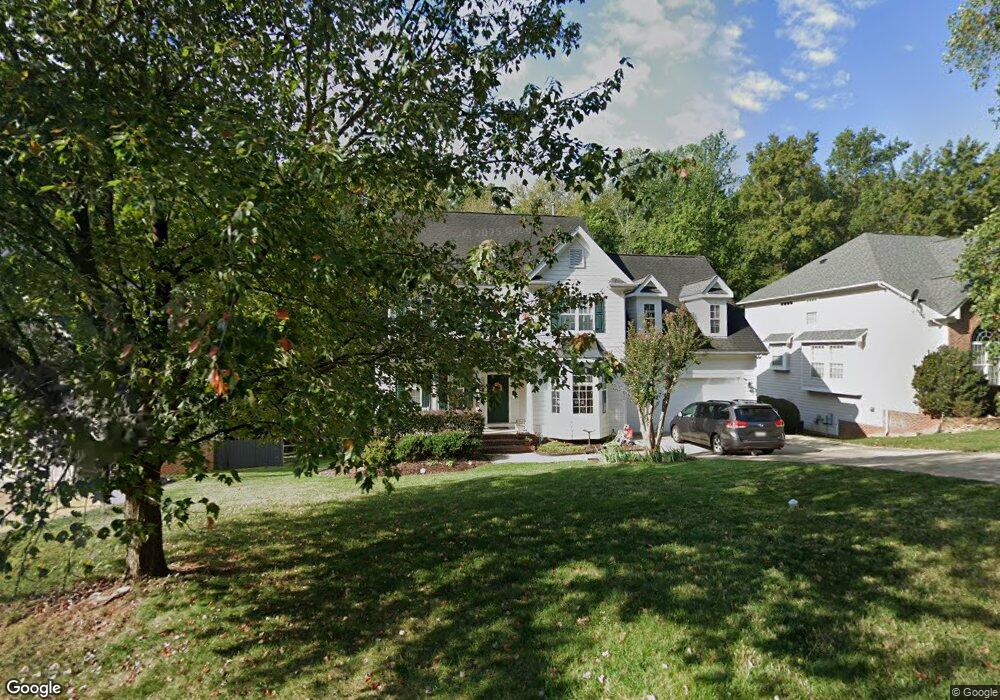
5024 Bartons Enclave Ln Raleigh, NC 27613
Estimated Value: $744,000 - $866,000
5
Beds
4
Baths
3,758
Sq Ft
$216/Sq Ft
Est. Value
About This Home
This home is located at 5024 Bartons Enclave Ln, Raleigh, NC 27613 and is currently estimated at $812,305, approximately $216 per square foot. 5024 Bartons Enclave Ln is a home located in Wake County with nearby schools including Pine Hollow Middle School, Leesville Road High School, and The Franciscan School.
Ownership History
Date
Name
Owned For
Owner Type
Purchase Details
Closed on
Feb 1, 2013
Sold by
Rivera Theodore and Rivera Barbara
Bought by
Roche Stephen and Roche Christine
Current Estimated Value
Home Financials for this Owner
Home Financials are based on the most recent Mortgage that was taken out on this home.
Original Mortgage
$285,000
Outstanding Balance
$198,954
Interest Rate
3.38%
Mortgage Type
New Conventional
Estimated Equity
$613,351
Purchase Details
Closed on
May 7, 2001
Sold by
Alpha Development Group Llc
Bought by
Rivera Theodore and Rivera Barbara
Home Financials for this Owner
Home Financials are based on the most recent Mortgage that was taken out on this home.
Original Mortgage
$230,000
Interest Rate
6.9%
Purchase Details
Closed on
May 8, 2000
Sold by
Weekley Homes Lp
Bought by
Alpha Development Group Llc
Create a Home Valuation Report for This Property
The Home Valuation Report is an in-depth analysis detailing your home's value as well as a comparison with similar homes in the area
Home Values in the Area
Average Home Value in this Area
Purchase History
| Date | Buyer | Sale Price | Title Company |
|---|---|---|---|
| Roche Stephen | $370,000 | None Available | |
| Rivera Theodore | $330,000 | -- | |
| Alpha Development Group Llc | $156,000 | -- |
Source: Public Records
Mortgage History
| Date | Status | Borrower | Loan Amount |
|---|---|---|---|
| Open | Roche Stephen | $285,000 | |
| Previous Owner | Rivera Theodore | $230,000 |
Source: Public Records
Tax History Compared to Growth
Tax History
| Year | Tax Paid | Tax Assessment Tax Assessment Total Assessment is a certain percentage of the fair market value that is determined by local assessors to be the total taxable value of land and additions on the property. | Land | Improvement |
|---|---|---|---|---|
| 2025 | $4,273 | $665,001 | $120,000 | $545,001 |
| 2024 | $4,150 | $665,001 | $120,000 | $545,001 |
| 2023 | $3,432 | $437,574 | $100,000 | $337,574 |
| 2022 | $3,180 | $437,574 | $100,000 | $337,574 |
| 2021 | $3,095 | $437,574 | $100,000 | $337,574 |
| 2020 | $3,044 | $437,574 | $100,000 | $337,574 |
| 2019 | $3,200 | $389,350 | $110,000 | $279,350 |
| 2018 | $2,942 | $389,350 | $110,000 | $279,350 |
| 2017 | $2,788 | $389,350 | $110,000 | $279,350 |
| 2016 | $2,732 | $389,350 | $110,000 | $279,350 |
| 2015 | $3,136 | $448,674 | $106,000 | $342,674 |
| 2014 | $2,972 | $448,674 | $106,000 | $342,674 |
Source: Public Records
Map
Nearby Homes
- 5240 Indigo Moon Way
- 12316 Amoretto Way
- 2729 Sunnystone Way
- 5020 Red Cedar Rd
- 11209 Sedgefield Dr
- 11113 N Radner Way
- 5316 Easthorpe Dr
- 11913 Eagle Bluff Cir
- 12200 Inglehurst Dr
- 5308 Roan Mountain Place
- 11953 Eagle Cliff Ct
- 12316 Inglehurst Dr
- 5000 Morning Edge Dr
- 11017 Peacock Moss St
- 5501 Stewartby Dr
- 5008 Dawn Piper Dr
- 12304 Whartons Way
- 5024 Dawn Piper Dr
- 1204 Meadow Moss Ct
- 5700 Earlham Ct
- 5028 Bartons Enclave Ln
- 5020 Bartons Enclave Ln
- 5032 Bartons Enclave Ln
- 5016 Bartons Enclave Ln
- 5021 Bartons Enclave Ln
- 5029 Bartons Enclave Ln
- 5036 Bartons Enclave Ln
- 5013 Bartons Enclave Ln
- 5012 Bartons Enclave Ln
- 5033 Bartons Enclave Ln
- 5040 Bartons Enclave Ln
- 5008 Bartons Enclave Ln
- 5005 Bartons Enclave Ln
- 5033 Big Creek Rd
- 5041 Bartons Enclave Ln
- 5044 Bartons Enclave Ln
- 5037 Big Creek Rd
- 5004 Bartons Enclave Ln
- 5029 Big Creek Rd
- 5048 Bartons Enclave Ln