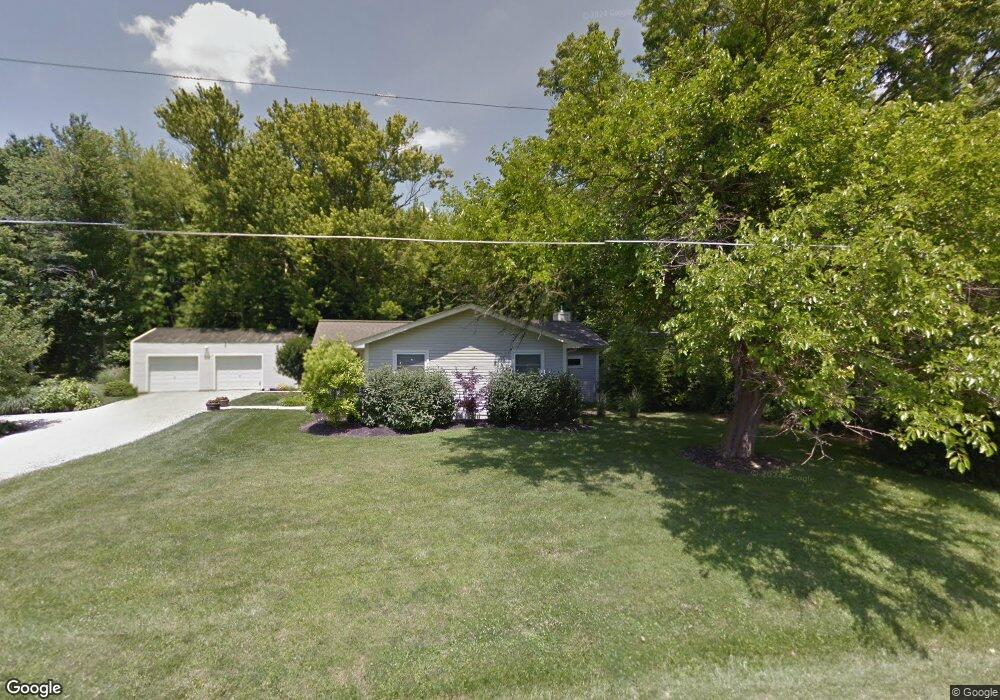
5024 Brant Rd Unit 48 Morrow, OH 45152
Salem Township NeighborhoodEstimated Value: $299,734 - $419,000
3
Beds
4
Baths
1,534
Sq Ft
$220/Sq Ft
Est. Value
About This Home
This home is located at 5024 Brant Rd Unit 48, Morrow, OH 45152 and is currently estimated at $337,684, approximately $220 per square foot. 5024 Brant Rd Unit 48 is a home located in Warren County with nearby schools including Little Miami Early Childhood Center, Little Miami Intermediate Middle School, and Little Miami Middle School.
Ownership History
Date
Name
Owned For
Owner Type
Purchase Details
Closed on
Jul 11, 2019
Sold by
Baum Duane A and Baum Patti J
Bought by
Polewchak James L
Current Estimated Value
Purchase Details
Closed on
Jun 30, 2010
Sold by
Allison Gregory A and Allison Angela
Bought by
Baum Duane A and Baum Patti J
Home Financials for this Owner
Home Financials are based on the most recent Mortgage that was taken out on this home.
Original Mortgage
$164,219
Interest Rate
4.77%
Mortgage Type
New Conventional
Purchase Details
Closed on
Feb 6, 2006
Sold by
Allison Greg and Allison Angie
Bought by
Allison Gregory A
Purchase Details
Closed on
Mar 22, 2005
Sold by
Remax Results Plus Llc
Bought by
Allison Greg and Allison Angie
Purchase Details
Closed on
Apr 26, 1985
Sold by
O'Brien O'Brien and O'Brien Robert J
Bought by
Sobczak Sobczak and Sobczak Mary Ann
Create a Home Valuation Report for This Property
The Home Valuation Report is an in-depth analysis detailing your home's value as well as a comparison with similar homes in the area
Home Values in the Area
Average Home Value in this Area
Purchase History
| Date | Buyer | Sale Price | Title Company |
|---|---|---|---|
| Polewchak James L | $233,000 | None Available | |
| Baum Duane A | $161,000 | Platinum Title | |
| Allison Gregory A | -- | Premier Title Services | |
| Allison Greg | $40,000 | -- | |
| Sobczak Sobczak | -- | -- |
Source: Public Records
Mortgage History
| Date | Status | Borrower | Loan Amount |
|---|---|---|---|
| Previous Owner | Baum Duane A | $164,219 |
Source: Public Records
Tax History Compared to Growth
Tax History
| Year | Tax Paid | Tax Assessment Tax Assessment Total Assessment is a certain percentage of the fair market value that is determined by local assessors to be the total taxable value of land and additions on the property. | Land | Improvement |
|---|---|---|---|---|
| 2024 | $3,393 | $75,160 | $25,940 | $49,220 |
| 2023 | $3,053 | $60,298 | $17,640 | $42,658 |
| 2022 | $3,022 | $60,298 | $17,640 | $42,658 |
| 2021 | $2,887 | $60,298 | $17,640 | $42,658 |
| 2020 | $2,828 | $50,250 | $14,700 | $35,550 |
| 2019 | $2,878 | $50,250 | $14,700 | $35,550 |
| 2018 | $2,925 | $50,250 | $14,700 | $35,550 |
| 2017 | $2,685 | $45,227 | $13,157 | $32,071 |
| 2016 | $2,740 | $45,227 | $13,157 | $32,071 |
| 2015 | $2,567 | $45,227 | $13,157 | $32,071 |
| 2014 | $2,626 | $41,430 | $12,280 | $29,160 |
| 2013 | $2,583 | $48,880 | $14,000 | $34,880 |
Source: Public Records
Map
Nearby Homes
- 2841 Ohio 123
- 5323 US Rt 22 & 3
- 4645 Ward Rd
- 5565 E US Rt 22 & 3
- Lot 3 State Route 123
- Lot 2 State Route 123
- Lot 4 State Route 123
- 251 Westview Dr
- 5031 Ohio 123
- 6051 U S 22 Unit 56
- 350 2nd St
- 501 Us-22 & 3
- 105 Welch Rd
- 501 W Pike St
- 606 W Pike St
- 114 Highlawn Ave
- 3155 Rosemary Ct Unit Lot 94
- 3155 Rosemary Ct
- 4980 Lakeview Dr
- 945 S Nixon Camp Rd
- 5024 Brant Rd
- 4982 Brant Rd
- 4989 Brant Rd
- 4967 Brant Rd
- 5015 Brant Rd
- 4940 Brant Rd
- 4935 Brant Rd
- 4908 Brant Rd
- 4953 Brant Rd
- 4880 Brant Rd
- 4875 Brant Rd
- 3340 S State Route 123
- 4850 Brant Rd
- 4849 Brant Rd
- 3152 State Route 123
- 3288 S State Route 123
- 3262 S State Route 123
- 3128 State Route 123
- 3674 Anderson Rd
- 3300 S State Route 123