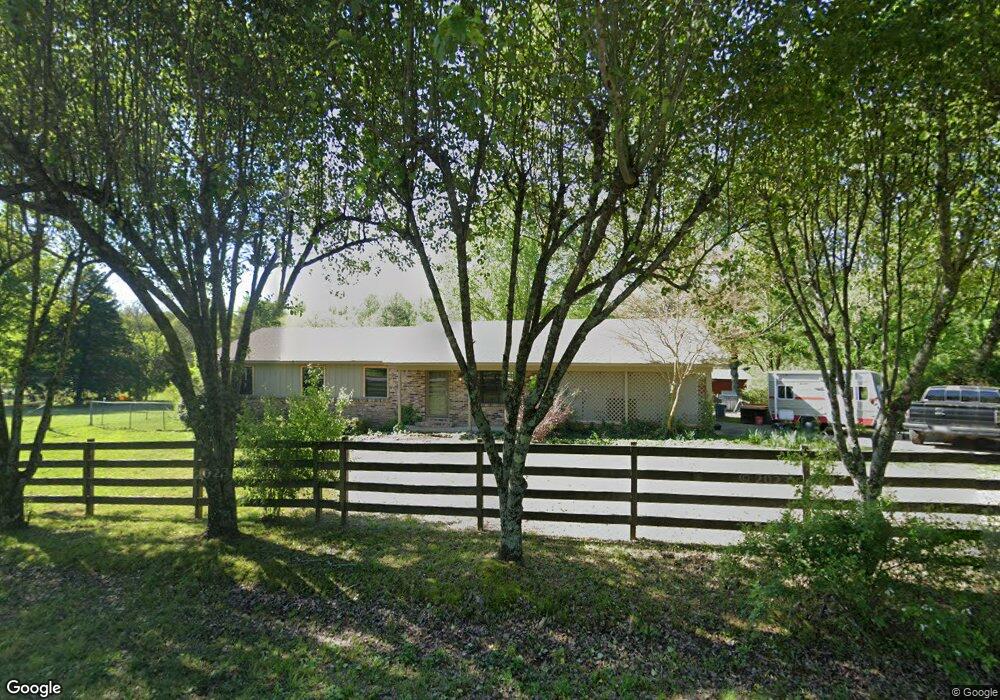
5024 Jones Loop Rd Little Rock, AR 72223
Estimated Value: $213,000 - $445,000
--
Bed
2
Baths
1,792
Sq Ft
$157/Sq Ft
Est. Value
About This Home
This home is located at 5024 Jones Loop Rd, Little Rock, AR 72223 and is currently estimated at $282,138, approximately $157 per square foot. 5024 Jones Loop Rd is a home located in Pulaski County with nearby schools including Chenal Elementary School, Joe T. Robinson Middle School, and Joe T. Robinson High School.
Ownership History
Date
Name
Owned For
Owner Type
Purchase Details
Closed on
Jun 3, 2025
Sold by
Curtis Gregg and Curtis Julie
Bought by
Curtis Cody
Current Estimated Value
Purchase Details
Closed on
Feb 10, 2014
Sold by
Mulkey Moore Catherine and Mulkey Catherine S
Bought by
Mulkey Catherine S
Home Financials for this Owner
Home Financials are based on the most recent Mortgage that was taken out on this home.
Original Mortgage
$68,878
Interest Rate
4.56%
Mortgage Type
New Conventional
Purchase Details
Closed on
Jul 30, 2002
Sold by
Webb Edie
Bought by
Mulkey James R
Home Financials for this Owner
Home Financials are based on the most recent Mortgage that was taken out on this home.
Original Mortgage
$85,500
Interest Rate
6.53%
Create a Home Valuation Report for This Property
The Home Valuation Report is an in-depth analysis detailing your home's value as well as a comparison with similar homes in the area
Home Values in the Area
Average Home Value in this Area
Purchase History
| Date | Buyer | Sale Price | Title Company |
|---|---|---|---|
| Curtis Cody | -- | American Abstract & Title | |
| Mulkey Catherine S | -- | Bankers Title | |
| Mulkey James R | $136,000 | First National Title Company |
Source: Public Records
Mortgage History
| Date | Status | Borrower | Loan Amount |
|---|---|---|---|
| Previous Owner | Mulkey Catherine S | $68,878 | |
| Previous Owner | Mulkey James R | $85,500 |
Source: Public Records
Tax History Compared to Growth
Tax History
| Year | Tax Paid | Tax Assessment Tax Assessment Total Assessment is a certain percentage of the fair market value that is determined by local assessors to be the total taxable value of land and additions on the property. | Land | Improvement |
|---|---|---|---|---|
| 2025 | $1,698 | $33,416 | $4,400 | $29,016 |
| 2024 | $1,698 | $33,416 | $4,400 | $29,016 |
| 2023 | $1,698 | $33,416 | $4,400 | $29,016 |
| 2022 | $1,975 | $33,416 | $4,400 | $29,016 |
| 2021 | $1,477 | $28,090 | $2,000 | $26,090 |
| 2020 | $1,376 | $28,090 | $2,000 | $26,090 |
| 2019 | $994 | $28,090 | $2,000 | $26,090 |
| 2018 | $961 | $28,090 | $2,000 | $26,090 |
| 2017 | $904 | $28,090 | $2,000 | $26,090 |
| 2016 | $1,147 | $22,570 | $3,000 | $19,570 |
| 2015 | $1,147 | $22,570 | $3,000 | $19,570 |
| 2014 | $1,147 | $22,570 | $3,000 | $19,570 |
Source: Public Records
Map
Nearby Homes
- 4109 Garrison Rd
- 0 Garrison Rd E Unit 22020907
- 0 Garrison Rd W Unit 22020890
- 3110 Ferndale Cut Off Rd
- 23 Witness Tree Ln
- 5020 Copper Creek Ln
- 5121 Copper Creek Ln
- 0 Garrison Rd N Unit 22021042
- 10119 Garrison Rd
- 0 Studer Rd
- 29100 Bandy Rd
- 21 Somersett Dr
- 0 Bandy North E Unit 22022753
- 0 Bandy South E Unit 22022758
- 6918 Neal Creek Rd
- Lot 4 Wilton Ln Unit Mills Mountain Rd
- 0 Bandy Road South W Unit 22020705
- 7142 Neal Creek Rd
- 25501 Kanis Rd
- 32315 Kanis Rd
- 5006 Jones Loop Rd
- 4920 Jones Loop Rd
- 5015 Jones Loop Rd
- 5125 Jones Loop Rd
- 4816 Jones Loop Rd
- 5224 Jones Loop Rd
- 5025 Garrison Rd
- 5319 Jones Loop Rd
- 5205 Garrison Rd
- 5400 Jones Loop Rd
- 4811 Jones Loop Rd
- 4915 Garrison Rd
- 25420 Ginger Hill Cir
- 5209 Garrison Rd
- 4624 Jones Loop Rd
- 4721 Jones Loop Rd
- 4811 Garrison Rd
- 4701 Jones Loop Rd
- 4807 Ginger Hill Rd
- 25504 Ginger Hill Cir