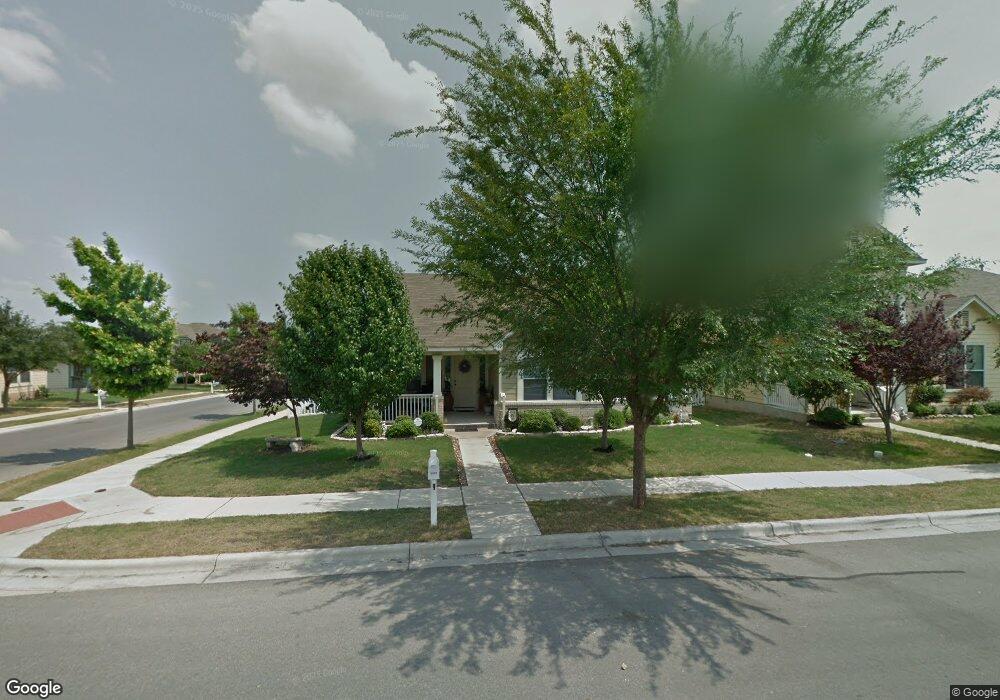
5025 Hartson Kyle, TX 78640
Plum Creek NeighborhoodEstimated Value: $299,149 - $345,000
Studio
--
Bath
1,844
Sq Ft
$175/Sq Ft
Est. Value
About This Home
This home is located at 5025 Hartson, Kyle, TX 78640 and is currently estimated at $322,287, approximately $174 per square foot. 5025 Hartson is a home located in Hays County with nearby schools including Laura B Negley Elementary School, R C Barton Middle School, and Jack C Hays High School.
Ownership History
Date
Name
Owned For
Owner Type
Purchase Details
Closed on
Jun 18, 2004
Sold by
Continental Homes Of Texas Lp
Bought by
White Kelly and White Glynda N
Current Estimated Value
Home Financials for this Owner
Home Financials are based on the most recent Mortgage that was taken out on this home.
Original Mortgage
$164,701
Outstanding Balance
$82,234
Interest Rate
6.32%
Mortgage Type
FHA
Estimated Equity
$240,053
Purchase Details
Closed on
Feb 3, 2004
Sold by
Plum Creek Development Partners Ltd
Bought by
Continental Homes Of Texas Lp
Create a Home Valuation Report for This Property
The Home Valuation Report is an in-depth analysis detailing your home's value as well as a comparison with similar homes in the area
Home Values in the Area
Average Home Value in this Area
Purchase History
| Date | Buyer | Sale Price | Title Company |
|---|---|---|---|
| White Kelly | -- | Dhi Title | |
| Continental Homes Of Texas Lp | -- | Travis Title Co |
Source: Public Records
Mortgage History
| Date | Status | Borrower | Loan Amount |
|---|---|---|---|
| Open | White Kelly | $164,701 |
Source: Public Records
Tax History
| Year | Tax Paid | Tax Assessment Tax Assessment Total Assessment is a certain percentage of the fair market value that is determined by local assessors to be the total taxable value of land and additions on the property. | Land | Improvement |
|---|---|---|---|---|
| 2025 | $5,917 | $326,715 | $70,800 | $255,915 |
| 2024 | $73 | $322,900 | $70,800 | $252,100 |
| 2023 | $6,806 | $304,653 | $88,500 | $279,020 |
| 2022 | $6,741 | $276,957 | $75,000 | $291,770 |
| 2021 | $6,680 | $251,779 | $39,200 | $225,430 |
| 2019 | $6,471 | $234,250 | $29,400 | $204,850 |
| 2018 | $6,250 | $225,660 | $21,000 | $204,660 |
| 2017 | $5,911 | $209,671 | $21,000 | $196,370 |
| 2016 | $5,373 | $190,610 | $21,000 | $169,610 |
| 2015 | $4,314 | $180,774 | $21,000 | $160,620 |
Source: Public Records
Map
Nearby Homes
Your Personal Tour Guide
Ask me questions while you tour the home.