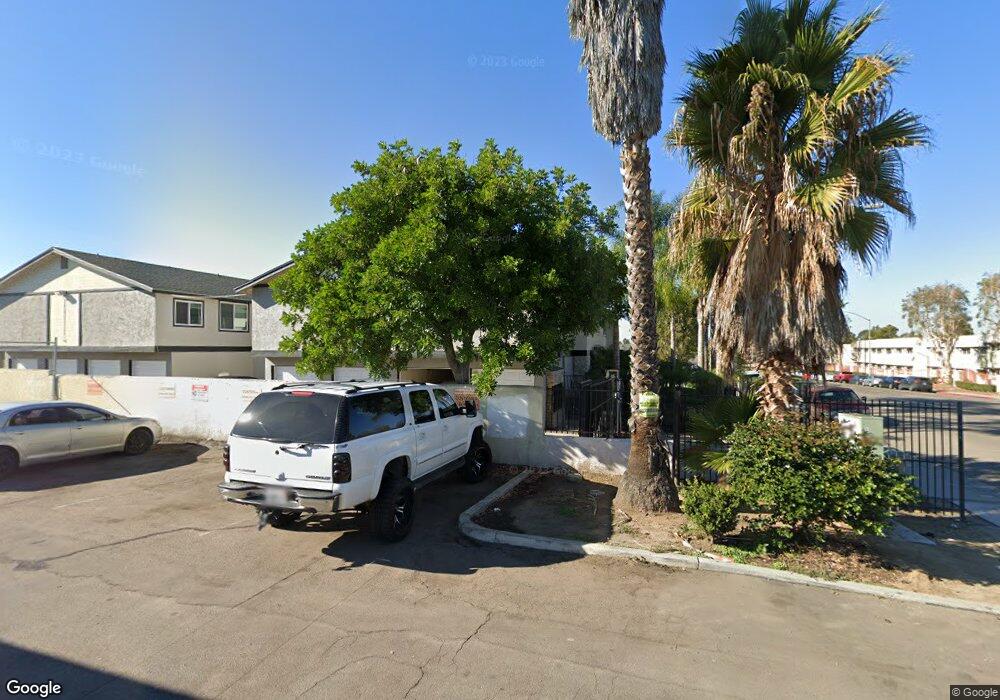
5025 Logan Ave Unit 12 San Diego, CA 92113
Lincoln Park NeighborhoodEstimated Value: $289,000 - $384,703
2
Beds
2
Baths
748
Sq Ft
$469/Sq Ft
Est. Value
About This Home
This home is located at 5025 Logan Ave Unit 12, San Diego, CA 92113 and is currently estimated at $351,176, approximately $469 per square foot. 5025 Logan Ave Unit 12 is a home located in San Diego County with nearby schools including Porter Elementary School, Knox Middle, and Lincoln High School.
Ownership History
Date
Name
Owned For
Owner Type
Purchase Details
Closed on
Jun 20, 2019
Sold by
Bennett Craig M and Craig M Bennett Living Trust
Bought by
Loginovs A Llc
Current Estimated Value
Home Financials for this Owner
Home Financials are based on the most recent Mortgage that was taken out on this home.
Original Mortgage
$2,800,000
Interest Rate
3.5%
Mortgage Type
Commercial
Purchase Details
Closed on
Dec 19, 2018
Sold by
Immobilier Solmelia Llc
Bought by
Dego Inc
Purchase Details
Closed on
Jul 27, 2012
Sold by
Sc Solmelia Llc
Bought by
Immobilier Solmelia Llc
Home Financials for this Owner
Home Financials are based on the most recent Mortgage that was taken out on this home.
Original Mortgage
$1,350,000
Interest Rate
3.65%
Mortgage Type
Purchase Money Mortgage
Create a Home Valuation Report for This Property
The Home Valuation Report is an in-depth analysis detailing your home's value as well as a comparison with similar homes in the area
Home Values in the Area
Average Home Value in this Area
Purchase History
| Date | Buyer | Sale Price | Title Company |
|---|---|---|---|
| Loginovs A Llc | $4,150,000 | Chicago Title Co Com Div | |
| Dego Inc | -- | None Available | |
| Immobilier Solmelia Llc | $2,250,000 | First American Title |
Source: Public Records
Mortgage History
| Date | Status | Borrower | Loan Amount |
|---|---|---|---|
| Previous Owner | Loginovs A Llc | $2,800,000 | |
| Previous Owner | Immobilier Solmelia Llc | $1,350,000 |
Source: Public Records
Tax History Compared to Growth
Tax History
| Year | Tax Paid | Tax Assessment Tax Assessment Total Assessment is a certain percentage of the fair market value that is determined by local assessors to be the total taxable value of land and additions on the property. | Land | Improvement |
|---|---|---|---|---|
| 2025 | $2,665 | $218,723 | $87,488 | $131,235 |
| 2024 | $2,665 | $214,435 | $85,773 | $128,662 |
| 2023 | $2,606 | $210,232 | $84,092 | $126,140 |
| 2022 | $2,537 | $206,111 | $82,444 | $123,667 |
| 2021 | $2,520 | $202,071 | $80,828 | $121,243 |
| 2020 | $2,490 | $200,000 | $80,000 | $120,000 |
| 2019 | $2,494 | $200,000 | $80,000 | $120,000 |
| 2018 | $1,301 | $108,221 | $27,054 | $81,167 |
| 2017 | $1,270 | $106,100 | $26,524 | $79,576 |
| 2016 | $1,250 | $104,020 | $26,004 | $78,016 |
| 2015 | $1,231 | $102,459 | $25,614 | $76,845 |
| 2014 | $1,213 | $100,453 | $25,113 | $75,340 |
Source: Public Records
Map
Nearby Homes
- 5033 La Paz Dr
- 5017 Reynolds St
- 5051 Pelusa St
- 4895 Bunnell St
- 1370 Wyconda Way
- 5211 Trinidad Way
- 635 S 47th St Unit 37
- 325 Gloria St
- 2305 Wisteria Way
- 312 S 49th St
- 237 S Willie James Jones Ave
- 5270 San Bernardo Terrace
- 745 West St
- 812 West St
- 222 50th St
- 239 50th St Unit 33
- 229 50th St Unit 20
- 5140 Castana St
- 307 S Belmont Ave
- 420 S 45th St
- 5025 Logan Ave Unit 18
- 5025 Logan Ave Unit 11
- 5023 Logan Ave Unit 10
- 5023 Logan Ave Unit 9
- 5023 Logan Ave Unit 8
- 5023 Logan Ave Unit 7
- 5023 Logan Ave Unit 6
- 5029 Logan Ave Unit 24
- 5029 Logan Ave Unit 23
- 5029 Logan Ave Unit 22
- 5029 Logan Ave Unit 21
- 5029 Logan Ave Unit 20
- 5025 Logan Ave Unit 17
- 5025 Logan Ave Unit 16
- 5025 Logan Ave Unit 15
- 5025 Logan Ave Unit 14
- 5021 Logan Ave Unit 7
- 5021 Logan Ave
- 5027 Logan Ave Unit 19
- 5021 Logan Ave Unit 5