5025 Shoreway Loop Unit 103 Orlando, FL 32819
Universal NeighborhoodEstimated Value: $567,683 - $604,000
3
Beds
2
Baths
2,097
Sq Ft
$279/Sq Ft
Est. Value
About This Home
This home is located at 5025 Shoreway Loop Unit 103, Orlando, FL 32819 and is currently estimated at $585,671, approximately $279 per square foot. 5025 Shoreway Loop Unit 103 is a home located in Orange County with nearby schools including Tangelo Park Elementary School, Westridge Middle School, and Orlando Torah Academy.
Ownership History
Date
Name
Owned For
Owner Type
Purchase Details
Closed on
Jan 10, 2012
Sold by
Casa Devito Jr Edson J and Casa De Vito Tania Luzia
Bought by
Telm Investment Llc
Current Estimated Value
Purchase Details
Closed on
Jul 8, 2010
Sold by
Suntrust Mortgage Inc
Bought by
Devito Edson Jose and Devito Tania Luzia Casa
Purchase Details
Closed on
Feb 22, 2010
Sold by
Mattingly Stephen and Case #48-2009-Ca-000641-O
Bought by
Suntrust Mortgage Inc
Purchase Details
Closed on
Feb 28, 2007
Sold by
Pulte Home Corp
Bought by
Mattingly Stephen S
Home Financials for this Owner
Home Financials are based on the most recent Mortgage that was taken out on this home.
Original Mortgage
$362,610
Interest Rate
7.62%
Mortgage Type
Purchase Money Mortgage
Create a Home Valuation Report for This Property
The Home Valuation Report is an in-depth analysis detailing your home's value as well as a comparison with similar homes in the area
Home Values in the Area
Average Home Value in this Area
Purchase History
| Date | Buyer | Sale Price | Title Company |
|---|---|---|---|
| Telm Investment Llc | -- | None Available | |
| Devito Edson Jose | $154,900 | Aloma Title Company | |
| Suntrust Mortgage Inc | -- | None Available | |
| Mattingly Stephen S | $402,900 | Landamerica Gulfatlantic Tit |
Source: Public Records
Mortgage History
| Date | Status | Borrower | Loan Amount |
|---|---|---|---|
| Previous Owner | Mattingly Stephen S | $362,610 |
Source: Public Records
Tax History Compared to Growth
Tax History
| Year | Tax Paid | Tax Assessment Tax Assessment Total Assessment is a certain percentage of the fair market value that is determined by local assessors to be the total taxable value of land and additions on the property. | Land | Improvement |
|---|---|---|---|---|
| 2025 | $6,456 | $417,561 | -- | -- |
| 2024 | $5,493 | $417,561 | -- | -- |
| 2023 | $5,493 | $367,000 | $73,400 | $293,600 |
| 2022 | $4,951 | $325,000 | $65,000 | $260,000 |
| 2021 | $4,521 | $285,200 | $57,040 | $228,160 |
| 2020 | $4,376 | $285,200 | $57,040 | $228,160 |
| 2019 | $4,633 | $285,200 | $57,040 | $228,160 |
| 2018 | $4,511 | $276,800 | $55,360 | $221,440 |
| 2017 | $4,116 | $247,400 | $49,480 | $197,920 |
| 2016 | $4,258 | $250,500 | $50,100 | $200,400 |
| 2015 | $4,221 | $251,600 | $50,320 | $201,280 |
| 2014 | $3,830 | $220,200 | $44,040 | $176,160 |
Source: Public Records
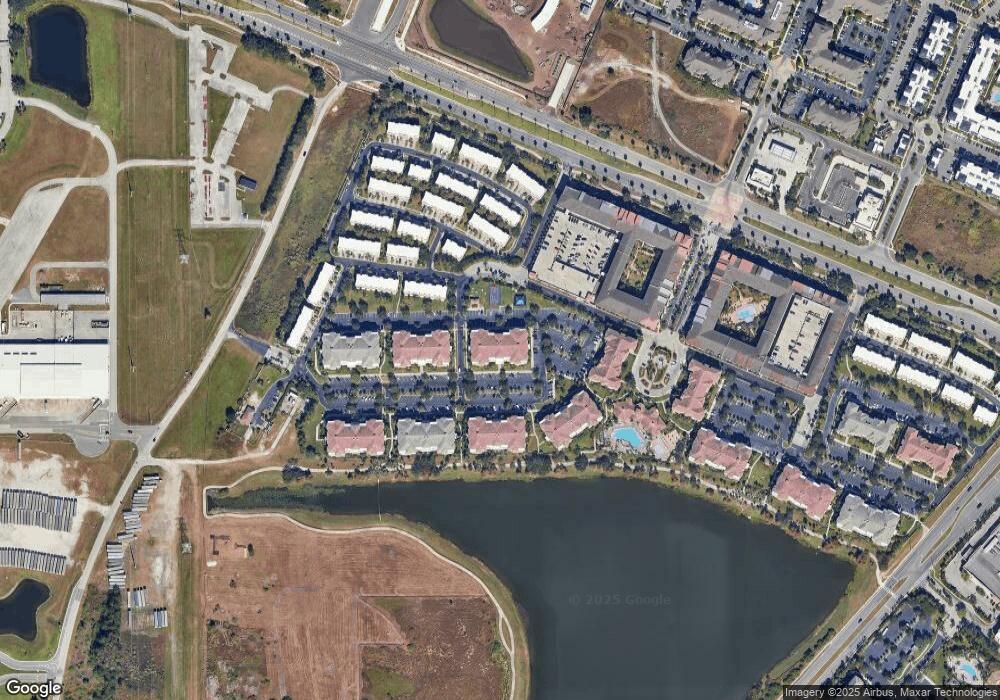
Map
Nearby Homes
- 5012 Shoreway Loop Unit 10107
- 5036 Shoreway Loop Unit 30505
- 5025 Shoreway Loop Unit 20503
- 5025 Shoreway Loop Unit 10703
- 5000 Cayview Ave Unit 30408
- 5000 Cayview Ave Unit 30908
- 5000 Cayview Ave Unit 10108
- 8001 Cool Breeze Dr Unit 121
- 5049 Shoreway Loop Unit 30101
- 8013 Cool Breeze Dr Unit 116
- 4862 Cayview Ave Unit 40409
- 4862 Cayview Ave Unit 306
- 4862 Cayview Ave Unit 20909
- 4862 Cayview Ave Unit 410
- 4862 Cayview Ave Unit 407
- 5076 Tideview Cir Unit 90
- 5026 Tideview Cir Unit 17
- 4816 Cayview Ave Unit 20111
- 5002 Tideview Cir Unit 3
- 4814 Cayview Ave Unit 21013
- 5025 Shoreway Loop Unit 307
- 5025 Shoreway Loop Unit 20103
- 5025 Shoreway Loop Unit 30703
- 5025 Shoreway Loop Unit 40803
- 5025 Shoreway Loop Unit 40303
- 5025 Shoreway Loop Unit 402
- 5025 Shoreway Loop Unit 10403
- 5025 Shoreway Loop Unit 303
- 5025 Shoreway Loop Unit 308
- 5025 Shoreway Loop Unit 405
- 5025 Shoreway Loop Unit 304
- 5025 Shoreway Loop Unit 40103
- 5025 Shoreway Loop Unit 20203
- 5025 Shoreway Loop Unit 102
- 5025 Shoreway Loop Unit 407
- 5025 Shoreway Loop Unit 108
- 5025 Shoreway Loop Unit 10503
- 5025 Shoreway Loop Unit 10603
- 5025 Shoreway Loop Unit 20603
- 5025 Shoreway Loop Unit 30103