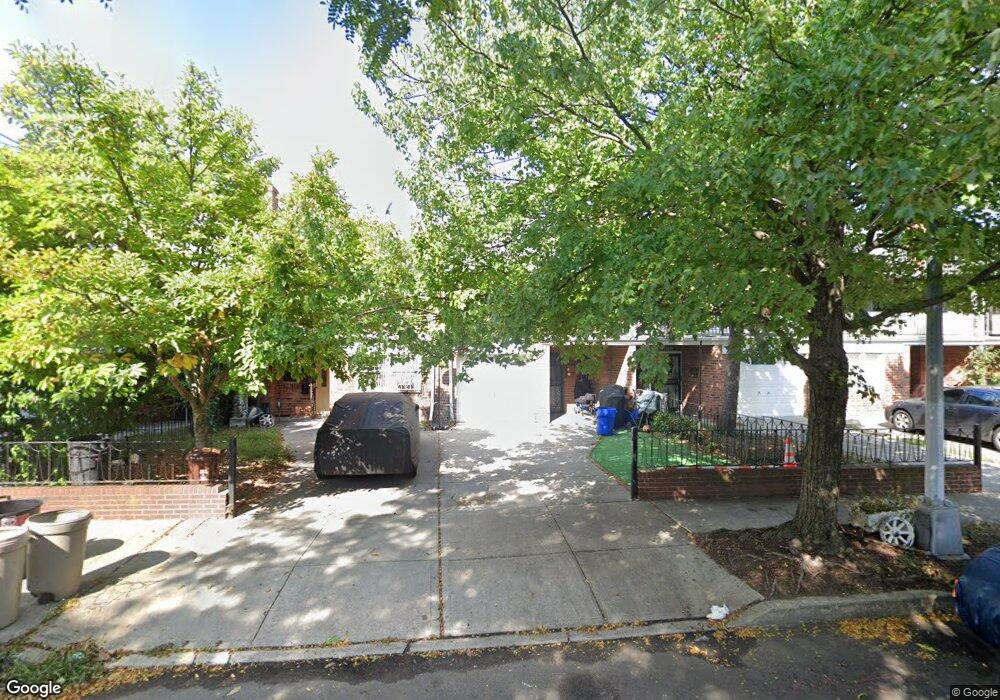
5026 65th St Woodside, NY 11377
Maspeth NeighborhoodEstimated Value: $923,359 - $1,148,000
--
Bed
--
Bath
1,780
Sq Ft
$605/Sq Ft
Est. Value
About This Home
This home is located at 5026 65th St, Woodside, NY 11377 and is currently estimated at $1,077,590, approximately $605 per square foot. 5026 65th St is a home located in Queens County with nearby schools including P.S. 229 Emanuel Kaplan, Is 5 The Walter Crowley Intermediate School, and Grover Cleveland High School.
Ownership History
Date
Name
Owned For
Owner Type
Purchase Details
Closed on
Dec 18, 2008
Sold by
Deangelis Angelo and Hofman Rosellen
Bought by
Li Bi Lian and Yang You Cai
Current Estimated Value
Home Financials for this Owner
Home Financials are based on the most recent Mortgage that was taken out on this home.
Original Mortgage
$340,500
Outstanding Balance
$224,434
Interest Rate
6.08%
Estimated Equity
$853,156
Purchase Details
Closed on
Aug 6, 2008
Sold by
Amedeo James
Bought by
Deangelis Angelo and Hofman Rosellen
Home Financials for this Owner
Home Financials are based on the most recent Mortgage that was taken out on this home.
Original Mortgage
$340,500
Interest Rate
6.08%
Purchase Details
Closed on
May 15, 2008
Sold by
Deangelis Albert and Rose Amodeo Ursitti
Bought by
Deangelis Angelo and Hofman Rosellen
Create a Home Valuation Report for This Property
The Home Valuation Report is an in-depth analysis detailing your home's value as well as a comparison with similar homes in the area
Home Values in the Area
Average Home Value in this Area
Purchase History
| Date | Buyer | Sale Price | Title Company |
|---|---|---|---|
| Li Bi Lian | $567,500 | -- | |
| Li Bi Lian | $567,500 | -- | |
| Deangelis Angelo | -- | -- | |
| Deangelis Angelo | -- | -- | |
| Deangelis Angelo | -- | -- | |
| Deangelis Angelo | -- | -- |
Source: Public Records
Mortgage History
| Date | Status | Borrower | Loan Amount |
|---|---|---|---|
| Open | Li Bi Lian | $340,500 | |
| Closed | Li Bi Lian | $340,500 | |
| Previous Owner | Deangelis Angelo | $340,500 |
Source: Public Records
Tax History Compared to Growth
Tax History
| Year | Tax Paid | Tax Assessment Tax Assessment Total Assessment is a certain percentage of the fair market value that is determined by local assessors to be the total taxable value of land and additions on the property. | Land | Improvement |
|---|---|---|---|---|
| 2025 | $7,823 | $42,768 | $12,957 | $29,811 |
| 2024 | $7,835 | $40,349 | $11,609 | $28,740 |
| 2023 | $7,723 | $39,850 | $11,097 | $28,753 |
| 2022 | $7,668 | $56,580 | $17,160 | $39,420 |
| 2021 | $7,654 | $50,100 | $17,160 | $32,940 |
| 2020 | $7,248 | $47,940 | $17,160 | $30,780 |
| 2019 | $6,741 | $52,800 | $17,160 | $35,640 |
| 2018 | $6,472 | $33,208 | $12,271 | $20,937 |
| 2017 | $6,470 | $33,208 | $12,663 | $20,545 |
| 2016 | $5,983 | $33,208 | $12,663 | $20,545 |
| 2015 | $3,559 | $29,700 | $14,530 | $15,170 |
| 2014 | $3,559 | $28,020 | $16,440 | $11,580 |
Source: Public Records
Map
Nearby Homes
- 51-01 64th St
- 51-17 64th St
- 50-12 64th St
- 5006 65th Place
- 5018 67th St
- 52-15 65th Place Unit 2A
- 52-15 65th Place Unit 3A
- 66-14 49th Ave
- 66-16 49th Ave
- 5221 65th Place Unit 6N
- 50-34 60th St
- 52-21 65th Place Unit 6P
- 52-24 65th Place Unit 3K
- 5224 66th St
- 52-60 65th Place Unit 5E
- 62-15 53rd Ave Unit LGD
- 49-12 69th St
- 67-29 52nd Rd
- 6731 52nd Rd
- 53-67 62nd St