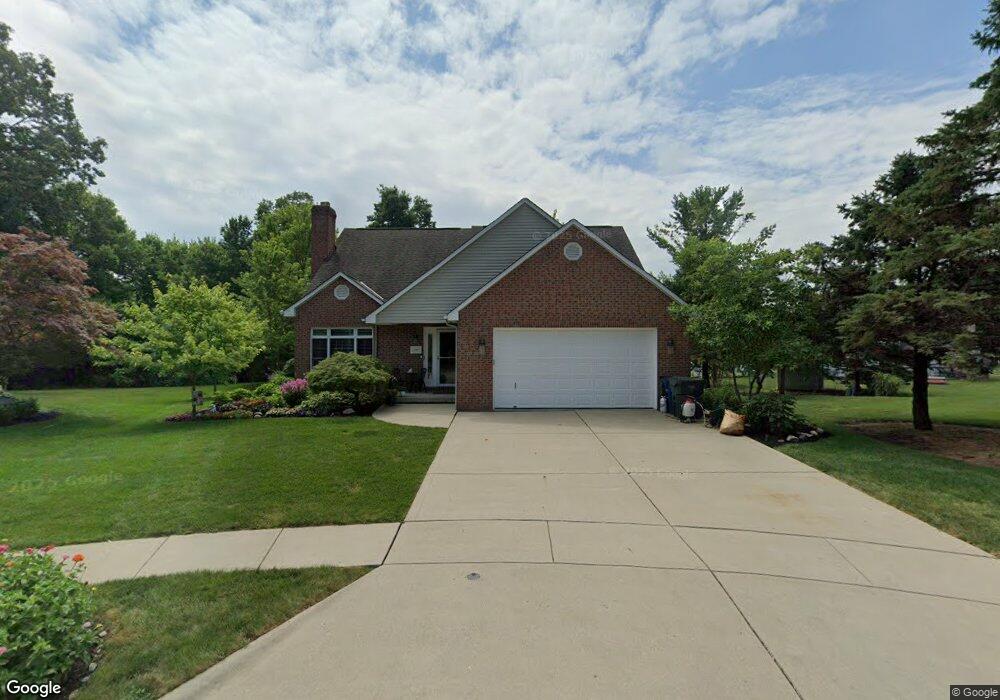
5026 Paula Ct Columbus, OH 43220
Knolls West NeighborhoodEstimated Value: $467,000 - $550,000
3
Beds
3
Baths
2,622
Sq Ft
$197/Sq Ft
Est. Value
About This Home
This home is located at 5026 Paula Ct, Columbus, OH 43220 and is currently estimated at $515,329, approximately $196 per square foot. 5026 Paula Ct is a home located in Franklin County with nearby schools including Winterset Elementary School, Ridgeview Middle School, and Centennial High School.
Ownership History
Date
Name
Owned For
Owner Type
Purchase Details
Closed on
Feb 10, 2025
Sold by
Moser John R and Moser Kathy L
Bought by
John And Kathy Moser Living Trust and Moser
Current Estimated Value
Purchase Details
Closed on
May 17, 2006
Sold by
Fee Donald and Trust Agreement Of Kathleen T
Bought by
Moser John R and Moser Kathy L
Home Financials for this Owner
Home Financials are based on the most recent Mortgage that was taken out on this home.
Original Mortgage
$249,500
Interest Rate
6.66%
Mortgage Type
Fannie Mae Freddie Mac
Purchase Details
Closed on
May 10, 2005
Sold by
Fee Kathleen T and Fee Kathleen
Bought by
Fee Kathleen T
Purchase Details
Closed on
Jan 26, 1999
Sold by
Pardi Paul E Builders Inc
Bought by
Fee Kathleen
Home Financials for this Owner
Home Financials are based on the most recent Mortgage that was taken out on this home.
Original Mortgage
$192,807
Interest Rate
6.75%
Mortgage Type
Seller Take Back
Purchase Details
Closed on
Dec 13, 1993
Create a Home Valuation Report for This Property
The Home Valuation Report is an in-depth analysis detailing your home's value as well as a comparison with similar homes in the area
Home Values in the Area
Average Home Value in this Area
Purchase History
| Date | Buyer | Sale Price | Title Company |
|---|---|---|---|
| John And Kathy Moser Living Trust | -- | None Listed On Document | |
| Moser John R | $249,500 | Title First | |
| Fee Kathleen T | -- | -- | |
| Fee Kathleen | $206,300 | Celtic Title Agency Inc | |
| -- | -- | -- |
Source: Public Records
Mortgage History
| Date | Status | Borrower | Loan Amount |
|---|---|---|---|
| Previous Owner | Moser John R | $249,500 | |
| Previous Owner | Fee Kathleen | $192,807 |
Source: Public Records
Tax History Compared to Growth
Tax History
| Year | Tax Paid | Tax Assessment Tax Assessment Total Assessment is a certain percentage of the fair market value that is determined by local assessors to be the total taxable value of land and additions on the property. | Land | Improvement |
|---|---|---|---|---|
| 2024 | $5,842 | $130,170 | $55,130 | $75,040 |
| 2023 | $5,767 | $130,165 | $55,125 | $75,040 |
| 2022 | $6,267 | $120,830 | $19,710 | $101,120 |
| 2021 | $6,278 | $120,830 | $19,710 | $101,120 |
| 2020 | $6,286 | $120,830 | $19,710 | $101,120 |
| 2019 | $5,786 | $95,380 | $15,750 | $79,630 |
| 2018 | $5,243 | $95,380 | $15,750 | $79,630 |
| 2017 | $5,783 | $95,380 | $15,750 | $79,630 |
| 2016 | $5,191 | $78,370 | $20,550 | $57,820 |
| 2015 | $4,713 | $78,370 | $20,550 | $57,820 |
| 2014 | $4,724 | $78,370 | $20,550 | $57,820 |
| 2013 | $4,438 | $74,620 | $19,565 | $55,055 |
Source: Public Records
Map
Nearby Homes
- 1558 Denbigh Dr
- 5111 Portland St
- 5111 Schuylkill St
- 1466 Weybridge Rd
- 1739 Paula Dr Unit 1739
- 4818 -4820 Winterset Dr
- 4924 Reed Rd Unit B
- 1835 Willoway Cir N
- 1540 Slade Ave Unit 303
- 1865 Willoway Cir N Unit 1865
- 1297 Slade Ave
- 1284 Slade Ave
- 5363 Godown Rd
- 1147 Langland Dr
- 1161 Bethel Rd Unit 103/104
- 4543 Ducrest Dr
- 4740 Merrifield Place Unit 25
- 4710 Charecote Ln Unit D
- 5268 Captains Ct
- 1594 Lafayette Dr Unit 1594
- 5034 Paula Ct
- 1584 Denbigh Dr
- 1570 Denbigh Dr
- 5025 Hibbs Dr Unit 5025
- 5027 Hibbs Dr Unit 5027
- 5023 Hibbs Dr Unit 5023
- 5010 Paula Ct
- 1592 Denbigh Dr
- 5010 Paula Ct
- 5029 Hibbs Dr
- 5021 Hibbs Dr Unit 5021
- 5035 Paula Ct
- 5019 Hibbs Dr Unit 5019
- 5029 Paula Ct
- 5011 Hibbs Dr
- 5017 Hibbs Dr Unit 5017
- 5023 Paula Ct
- 5015 Hibbs Dr
- 1546 Denbigh Dr
- 5035 Hibbs Dr Unit 5035