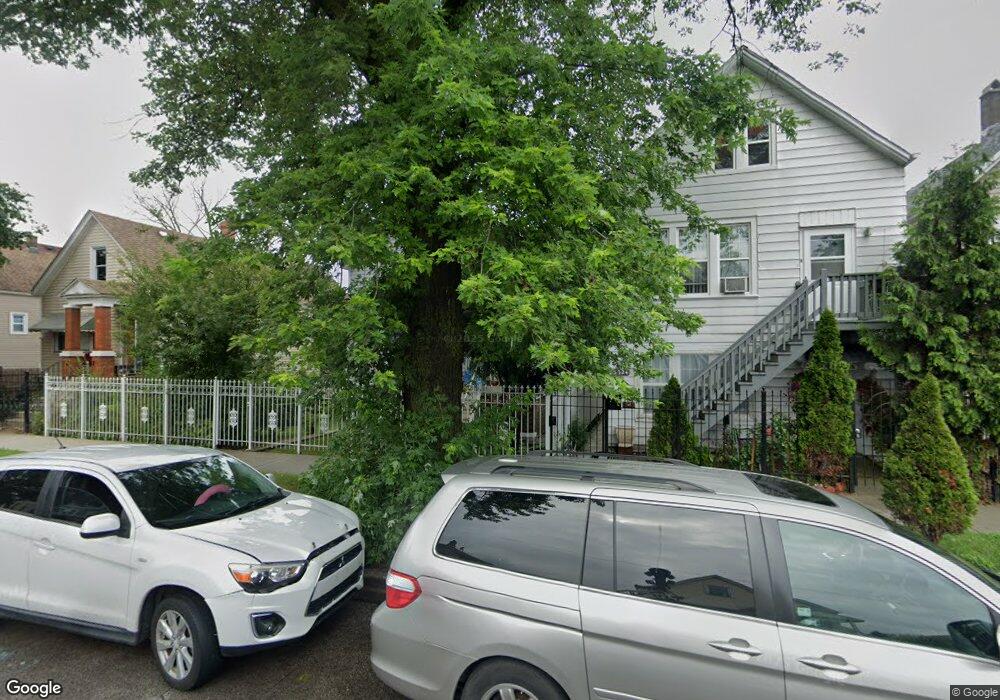
5026 S Seeley Ave Chicago, IL 60609
Back of the Yards NeighborhoodEstimated Value: $109,000 - $202,000
1
Bed
1
Bath
680
Sq Ft
$230/Sq Ft
Est. Value
About This Home
This home is located at 5026 S Seeley Ave, Chicago, IL 60609 and is currently estimated at $156,113, approximately $229 per square foot. 5026 S Seeley Ave is a home located in Cook County with nearby schools including Daley Elementary Academy and CICS Basil.
Ownership History
Date
Name
Owned For
Owner Type
Purchase Details
Closed on
Oct 24, 2003
Sold by
Alcantar Maria
Bought by
Lopez Raul
Current Estimated Value
Home Financials for this Owner
Home Financials are based on the most recent Mortgage that was taken out on this home.
Original Mortgage
$50,000
Interest Rate
6.01%
Mortgage Type
Unknown
Purchase Details
Closed on
Mar 28, 2002
Sold by
Lopez Maria and Alcantar Maria
Bought by
Alcantar Maria
Home Financials for this Owner
Home Financials are based on the most recent Mortgage that was taken out on this home.
Original Mortgage
$75,000
Interest Rate
9.62%
Purchase Details
Closed on
Feb 20, 1999
Sold by
Lopez Gilberto
Bought by
Lopez Maria
Purchase Details
Closed on
Oct 29, 1993
Sold by
Scott Kalvin O
Bought by
Lopez Gilbert and Lopez Maria
Home Financials for this Owner
Home Financials are based on the most recent Mortgage that was taken out on this home.
Original Mortgage
$45,700
Interest Rate
7%
Mortgage Type
FHA
Create a Home Valuation Report for This Property
The Home Valuation Report is an in-depth analysis detailing your home's value as well as a comparison with similar homes in the area
Home Values in the Area
Average Home Value in this Area
Purchase History
| Date | Buyer | Sale Price | Title Company |
|---|---|---|---|
| Lopez Raul | $100,000 | Multiple | |
| Alcantar Maria | -- | -- | |
| Lopez Maria | -- | -- | |
| Lopez Gilbert | $29,666 | -- |
Source: Public Records
Mortgage History
| Date | Status | Borrower | Loan Amount |
|---|---|---|---|
| Closed | Lopez Raul | $50,000 | |
| Previous Owner | Alcantar Maria | $75,000 | |
| Previous Owner | Lopez Gilbert | $45,700 |
Source: Public Records
Tax History Compared to Growth
Tax History
| Year | Tax Paid | Tax Assessment Tax Assessment Total Assessment is a certain percentage of the fair market value that is determined by local assessors to be the total taxable value of land and additions on the property. | Land | Improvement |
|---|---|---|---|---|
| 2024 | $887 | $12,000 | $1,786 | $10,214 |
| 2023 | $844 | $7,500 | $2,381 | $5,119 |
| 2022 | $844 | $7,500 | $2,381 | $5,119 |
| 2021 | $838 | $7,499 | $2,380 | $5,119 |
| 2020 | $771 | $6,541 | $2,976 | $3,565 |
| 2019 | $810 | $7,433 | $2,976 | $4,457 |
| 2018 | $795 | $7,433 | $2,976 | $4,457 |
| 2017 | $1,186 | $8,850 | $2,678 | $6,172 |
| 2016 | $1,281 | $8,850 | $2,678 | $6,172 |
| 2015 | $1,149 | $8,850 | $2,678 | $6,172 |
| 2014 | $1,141 | $8,670 | $2,529 | $6,141 |
| 2013 | $1,107 | $8,670 | $2,529 | $6,141 |
Source: Public Records
Map
Nearby Homes
- 2139 W 50th Place
- 2050 W 52nd St
- 2103 W 52nd St
- 4944 S Honore St
- 2309 W 50th Place
- 5244 S Honore St
- 5310 S Wolcott Ave
- 1908 W 48th St
- 5217 S Wood St
- 5031 S Hermitage Ave
- 5225 S Wood St
- 5350 S Winchester Ave
- 5157 S Hermitage Ave
- 4800 S Wood St
- 5336 S Honore St
- 4926 S Western Ave
- 5043 S Artesian Ave
- 4953 S Paulina St
- 1756 W 48th St
- 5338 S Wood St
- 5028 S Seeley Ave
- 5024 S Seeley Ave
- 5024 S Seeley Ave
- 5022 S Seeley Ave
- 5030 S Seeley Ave
- 5020 S Seeley Ave
- 5032 S Seeley Ave
- 5036 S Seeley Ave
- 5016 S Seeley Ave
- 5014 S Seeley Ave
- 5038 S Seeley Ave
- 5038 S Seeley Ave
- 5031 S Hoyne Ave Unit 2
- 5031 S Hoyne Ave
- 5023 S Hoyne Ave
- 5040 S Seeley Ave
- 5012 S Seeley Ave
- 5012 S Seeley Ave
- 5019 S Hoyne Ave
- 5044 S Seeley Ave Unit 1