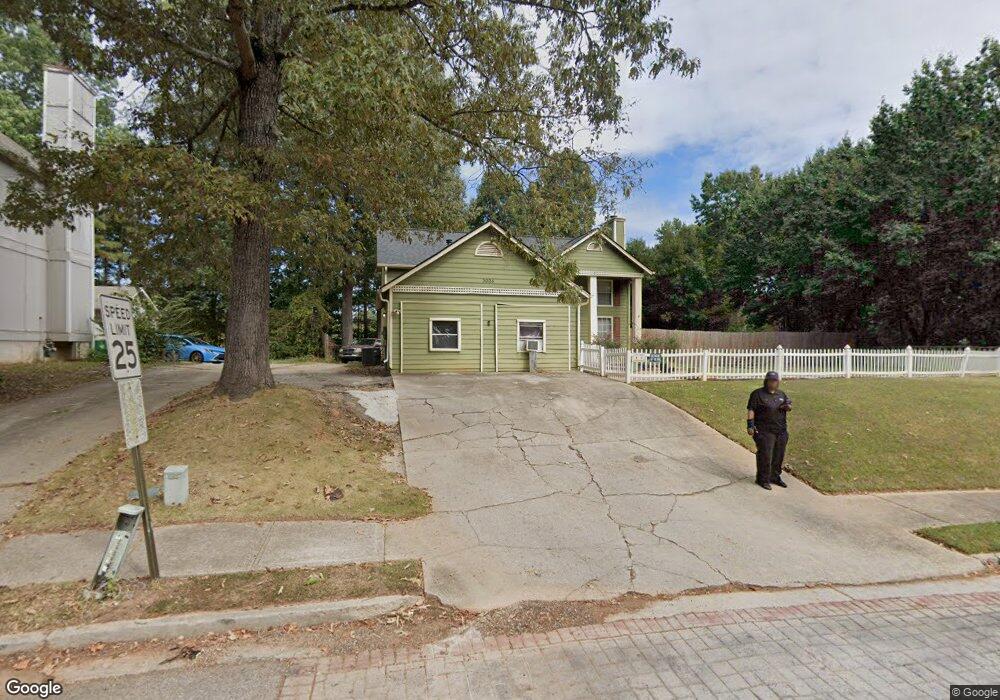
5026 Windsor Downs Dr Decatur, GA 30035
Southwest DeKalb NeighborhoodEstimated Value: $242,000 - $271,000
4
Beds
2
Baths
1,948
Sq Ft
$131/Sq Ft
Est. Value
About This Home
This home is located at 5026 Windsor Downs Dr, Decatur, GA 30035 and is currently estimated at $255,711, approximately $131 per square foot. 5026 Windsor Downs Dr is a home located in DeKalb County with nearby schools including Fairington Elementary School, Miller Grove Middle School, and Miller Grove High School.
Ownership History
Date
Name
Owned For
Owner Type
Purchase Details
Closed on
Jan 28, 2010
Sold by
Equity Bk Ssb
Bought by
Archer Jackie
Current Estimated Value
Purchase Details
Closed on
May 30, 2008
Sold by
Wells Fargo Bk Of Mn Na
Bought by
Equity Bk
Purchase Details
Closed on
Jul 3, 2007
Sold by
Moore Tracey
Bought by
Banc One Financial Svcs 1999-2
Purchase Details
Closed on
Apr 16, 1997
Sold by
Mccall Elizabeth
Bought by
Moore Tracey
Purchase Details
Closed on
Mar 31, 1995
Sold by
Robinson Casey D
Bought by
Mccall Elizabeth
Purchase Details
Closed on
Aug 20, 1993
Sold by
Diversified Shelter Group
Bought by
Robinson Casey D Alfreda
Home Financials for this Owner
Home Financials are based on the most recent Mortgage that was taken out on this home.
Original Mortgage
$77,765
Interest Rate
7.24%
Mortgage Type
FHA
Create a Home Valuation Report for This Property
The Home Valuation Report is an in-depth analysis detailing your home's value as well as a comparison with similar homes in the area
Home Values in the Area
Average Home Value in this Area
Purchase History
| Date | Buyer | Sale Price | Title Company |
|---|---|---|---|
| Archer Jackie | $32,000 | -- | |
| Equity Bk | $87,000 | -- | |
| Banc One Financial Svcs 1999-2 | $100,215 | -- | |
| Moore Tracey | $15,900 | -- | |
| Mccall Elizabeth | $86,100 | -- | |
| Robinson Casey D Alfreda | $78,900 | -- |
Source: Public Records
Mortgage History
| Date | Status | Borrower | Loan Amount |
|---|---|---|---|
| Previous Owner | Robinson Casey D Alfreda | $77,765 |
Source: Public Records
Tax History
| Year | Tax Paid | Tax Assessment Tax Assessment Total Assessment is a certain percentage of the fair market value that is determined by local assessors to be the total taxable value of land and additions on the property. | Land | Improvement |
|---|---|---|---|---|
| 2025 | $2,948 | $105,520 | $8,442 | $97,078 |
| 2024 | $3,003 | $105,520 | $8,442 | $97,078 |
| 2023 | $3,003 | $105,520 | $8,360 | $97,160 |
Source: Public Records
Map
Nearby Homes
- 4998 Windsor Downs Dr
- 4999 Windsor Downs Dr
- 2382 Miller Oaks Cir
- 4922 Windsor Downs Ln
- 4963 Windsor Downs Ln
- 4936 Windsor Downs Dr
- 5051 Chadwick Ct
- 4931 Wilkins Station Dr
- 4907 Windsor Downs Dr
- 4903 Windsor Downs Dr
- 4890 Wilkins Station Dr
- 5184 Miller Woods Dr
- 2291 Wilkins Ct
- 2290 Wilkins Cove
- 4856 Haymarket Trail
- 2276 Ramblewood Cir
- 2203 Hidden Creek Dr
- 4839 Plymouth Trace Unit 2
- 2461 Terrace Trail
- 2565 Terrace Trail
- 5022 Windsor Downs Dr
- 2448 Miller Oaks Cir
- 2452 Miller Oaks Cir
- 5016 Windsor Downs Dr
- 2422 Kentwell Ln
- 2444 Miller Oaks Cir
- 2456 Miller Oaks Cir
- 5012 Windsor Downs Dr
- 2428 Kentwell Ln
- 5004 Windsor Downs Dr
- 2440 Miller Oaks Cir
- 2460 Miller Oaks Cir
- 5009 Windsor Downs Dr
- 2432 Kentwell Ln
- 2449 Miller Oaks Cir
- 2434 Miller Oaks Cir
- 2459 Miller Oaks Cir
- 2464 Miller Oaks Cir
- 5003 Windsor Downs Dr
- 2436 Kentwell Ln
Your Personal Tour Guide
Ask me questions while you tour the home.