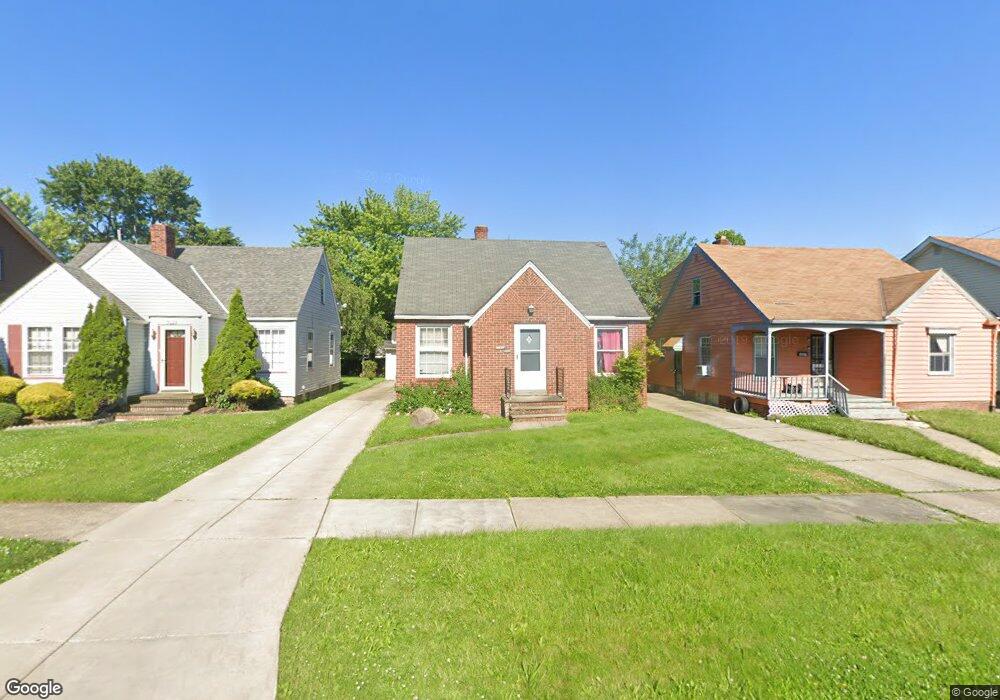
5027 E 114th St Cleveland, OH 44125
Estimated Value: $117,000 - $161,000
3
Beds
1
Bath
1,260
Sq Ft
$106/Sq Ft
Est. Value
About This Home
This home is located at 5027 E 114th St, Cleveland, OH 44125 and is currently estimated at $133,528, approximately $105 per square foot. 5027 E 114th St is a home located in Cuyahoga County with nearby schools including Garfield Heights High School, SMART Academy, and North Shore High School.
Ownership History
Date
Name
Owned For
Owner Type
Purchase Details
Closed on
Mar 25, 2009
Sold by
Citibank Na
Bought by
Calo Vincent J
Current Estimated Value
Purchase Details
Closed on
Nov 17, 2008
Sold by
Henry Kim
Bought by
Citibank Na
Purchase Details
Closed on
May 18, 2006
Sold by
Summit Estates Ltd and Payne Angela
Bought by
Henry Kim
Home Financials for this Owner
Home Financials are based on the most recent Mortgage that was taken out on this home.
Original Mortgage
$16,700
Interest Rate
6.62%
Mortgage Type
Stand Alone Second
Purchase Details
Closed on
Oct 13, 2005
Sold by
Federal Home Loan Mortgage Corporation
Bought by
Summit Estate Ltd
Purchase Details
Closed on
Aug 15, 2005
Sold by
Pelz William C and Pelz Victoria A
Bought by
Federal Home Loan Mortgage Corporation
Purchase Details
Closed on
Nov 18, 1993
Sold by
Pelz William C and Pelz Thelma
Bought by
Pelz William C
Purchase Details
Closed on
Jan 1, 1975
Bought by
Pelz William C and Pelz Thelma
Create a Home Valuation Report for This Property
The Home Valuation Report is an in-depth analysis detailing your home's value as well as a comparison with similar homes in the area
Home Values in the Area
Average Home Value in this Area
Purchase History
| Date | Buyer | Sale Price | Title Company |
|---|---|---|---|
| Calo Vincent J | $22,250 | None Available | |
| Citibank Na | $33,334 | None Available | |
| Henry Kim | $83,500 | Southeast | |
| Summit Estate Ltd | -- | Attorney | |
| Federal Home Loan Mortgage Corporation | $70,000 | -- | |
| Pelz William C | -- | -- | |
| Pelz William C | -- | -- |
Source: Public Records
Mortgage History
| Date | Status | Borrower | Loan Amount |
|---|---|---|---|
| Previous Owner | Henry Kim | $16,700 | |
| Previous Owner | Henry Kim | $66,800 |
Source: Public Records
Tax History
| Year | Tax Paid | Tax Assessment Tax Assessment Total Assessment is a certain percentage of the fair market value that is determined by local assessors to be the total taxable value of land and additions on the property. | Land | Improvement |
|---|---|---|---|---|
| 2025 | $3,453 | $41,265 | $8,155 | $33,110 |
| 2024 | $4,302 | $41,265 | $8,155 | $33,110 |
| 2023 | $2,478 | $21,250 | $5,080 | $16,170 |
| 2022 | $2,440 | $21,250 | $5,080 | $16,170 |
| 2021 | $2,577 | $21,250 | $5,080 | $16,170 |
| 2020 | $2,273 | $17,430 | $4,170 | $13,270 |
| 2019 | $2,254 | $49,800 | $11,900 | $37,900 |
| 2018 | $2,205 | $17,430 | $4,170 | $13,270 |
| 2017 | $2,170 | $15,690 | $3,890 | $11,800 |
| 2016 | $2,201 | $15,690 | $3,890 | $11,800 |
| 2015 | $2,416 | $15,690 | $3,890 | $11,800 |
| 2014 | $2,416 | $19,120 | $4,730 | $14,390 |
Source: Public Records
Map
Nearby Homes
- 11206 Park Heights Ave
- 5139 E 114th St
- 10925 Mccracken Rd
- 11017 Vernon Ave
- 11100 Wallingford Ave
- 11011 Wallingford Ave
- 5213 E 119th St
- 4915 E 111th St
- 5069 Henry St
- 4920 E 110th St
- 4922 E 109th St
- 10609 Wadsworth Ave
- 4902 E 109th St
- 10606 Langton Ave
- 4905 E 108th St
- 12403 Park Knoll Dr
- 11412 Granger Rd
- 5212 E 105th St
- 4885 E 107th St
- 12328 Granger Rd
- 5023 E 114th St
- 5023 E 114th St Unit E
- 5031 E 114th St
- 5035 E 114th St
- 5019 E 114th St
- 5039 E 114th St
- 5026 E 115th St
- 5030 E 115th St
- 5022 E 115th St
- 5018 E 115th St
- 11410 Edgepark Dr
- 5043 E 114th St
- 11404 Edgepark Dr
- 11414 Edgepark Dr
- 5034 E 115th St
- 5026 E 114th St
- 11418 Edgepark Dr
- 5022 E 114th St
- 5030 E 114th St
- 5018 E 114th St
Your Personal Tour Guide
Ask me questions while you tour the home.