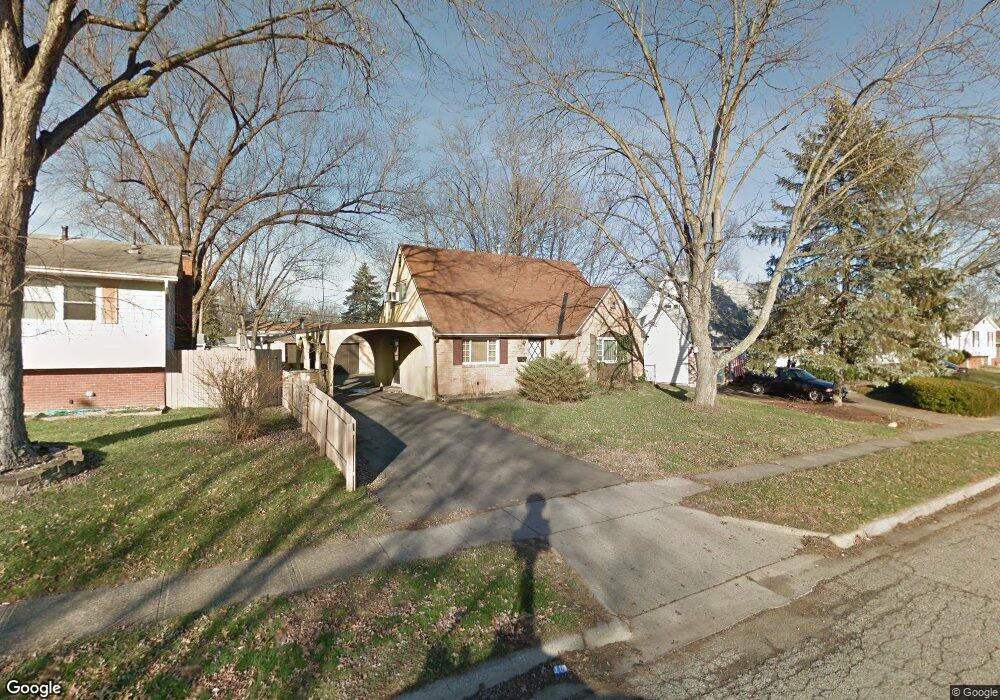
5028 Chipman Dr Columbus, OH 43232
East Columbus-White Ash NeighborhoodEstimated Value: $196,000 - $214,000
4
Beds
2
Baths
1,419
Sq Ft
$144/Sq Ft
Est. Value
About This Home
This home is located at 5028 Chipman Dr, Columbus, OH 43232 and is currently estimated at $204,447, approximately $144 per square foot. 5028 Chipman Dr is a home located in Franklin County with nearby schools including Groveport Madison High School and Eastland Preparatory Academy.
Ownership History
Date
Name
Owned For
Owner Type
Purchase Details
Closed on
Jun 7, 2016
Sold by
Sherman Alan J
Bought by
5028 Chipman Dr Llc
Current Estimated Value
Purchase Details
Closed on
Feb 2, 2016
Sold by
Deister Holdings Llc
Bought by
Sherman Alan
Purchase Details
Closed on
Apr 13, 2011
Sold by
Secretary Of Housing & Urban Development
Bought by
Deister Holdings Llc
Purchase Details
Closed on
Oct 30, 2009
Sold by
Wells David L and Case #07Cve 12 16488
Bought by
Citimortgage Inc
Purchase Details
Closed on
Jul 21, 2009
Sold by
Citimortgage Inc
Bought by
Secretary Of Housing & Urban Development
Purchase Details
Closed on
Jul 12, 2002
Sold by
Thomas Wavolene M and Garnett Sue
Bought by
Wells David L
Home Financials for this Owner
Home Financials are based on the most recent Mortgage that was taken out on this home.
Original Mortgage
$95,707
Interest Rate
6.23%
Mortgage Type
FHA
Purchase Details
Closed on
Jun 2, 1999
Sold by
Estate Of Robert L Thomas
Bought by
Thomas Wavolene M
Purchase Details
Closed on
Jul 12, 1967
Bought by
Thomas Robert L
Create a Home Valuation Report for This Property
The Home Valuation Report is an in-depth analysis detailing your home's value as well as a comparison with similar homes in the area
Home Values in the Area
Average Home Value in this Area
Purchase History
| Date | Buyer | Sale Price | Title Company |
|---|---|---|---|
| 5028 Chipman Dr Llc | -- | None Available | |
| Sherman Alan | $57,000 | Attorney | |
| Deister Holdings Llc | $36,000 | Lakeside Ti | |
| Citimortgage Inc | $58,000 | None Available | |
| Secretary Of Housing & Urban Development | -- | None Available | |
| Wells David L | $99,300 | Amerititle | |
| Thomas Wavolene M | -- | -- | |
| Thomas Robert L | -- | -- |
Source: Public Records
Mortgage History
| Date | Status | Borrower | Loan Amount |
|---|---|---|---|
| Previous Owner | Wells David L | $95,707 |
Source: Public Records
Tax History
| Year | Tax Paid | Tax Assessment Tax Assessment Total Assessment is a certain percentage of the fair market value that is determined by local assessors to be the total taxable value of land and additions on the property. | Land | Improvement |
|---|---|---|---|---|
| 2025 | $2,195 | $44,280 | $14,180 | $30,100 |
| 2024 | $2,195 | $44,280 | $14,180 | $30,100 |
| 2023 | $2,181 | $44,275 | $14,175 | $30,100 |
| 2022 | $1,443 | $23,210 | $6,300 | $16,910 |
| 2021 | $1,484 | $23,210 | $6,300 | $16,910 |
| 2020 | $1,488 | $23,210 | $6,300 | $16,910 |
| 2019 | $1,416 | $19,390 | $5,250 | $14,140 |
| 2018 | $1,300 | $19,390 | $5,250 | $14,140 |
| 2017 | $1,434 | $19,390 | $5,250 | $14,140 |
| 2016 | $1,181 | $14,350 | $4,340 | $10,010 |
| 2015 | $1,176 | $14,350 | $4,340 | $10,010 |
| 2014 | $1,065 | $14,350 | $4,340 | $10,010 |
| 2013 | $475 | $14,350 | $4,340 | $10,010 |
Source: Public Records
Map
Nearby Homes
- 3622 Alpena Rd
- 4980 Harbor Blvd
- 3856 Crestfield Dr Unit 3856
- 5106 Harbor Blvd
- 5308 Fullerton Dr
- 4995 Talford Ct
- 4473 Harrods St
- 3851 Wade Rd
- 4434 Harrods St
- 3824 Wade Rd
- 4925 Wymore Dr
- 4110 Wiston Dr Unit 4110
- 3493 Tremaine Rd
- 3455 Tremaine Rd
- 4296 Wincove Dr Unit 4296
- 3492 Rodell Rd
- 4363 Seahorse Ln Unit 4363
- 4547 Beachworth Ct
- 4496 Reinbeau Dr
- 4263 Cobbleton Grove Cir Unit 1
- 5036 Chipman Dr
- 5022 Chipman Dr
- 5017 Ewald Dr
- 5044 Chipman Dr
- 5029 Ewald Dr
- 5005 Ewald Dr
- 5035 Ewald Dr
- 5027 Chipman Dr
- 5001 Ewald Dr
- 5035 Chipman Dr
- 5056 Chipman Dr
- 5004 Chipman Dr
- 5021 Chipman Dr
- 5041 Chipman Dr
- 5041 Ewald Dr
- 5009 Chipman Dr
- 4983 Ewald Dr
- 5047 Chipman Dr
- 5068 Chipman Dr
- 4990 Chipman Dr
Your Personal Tour Guide
Ask me questions while you tour the home.