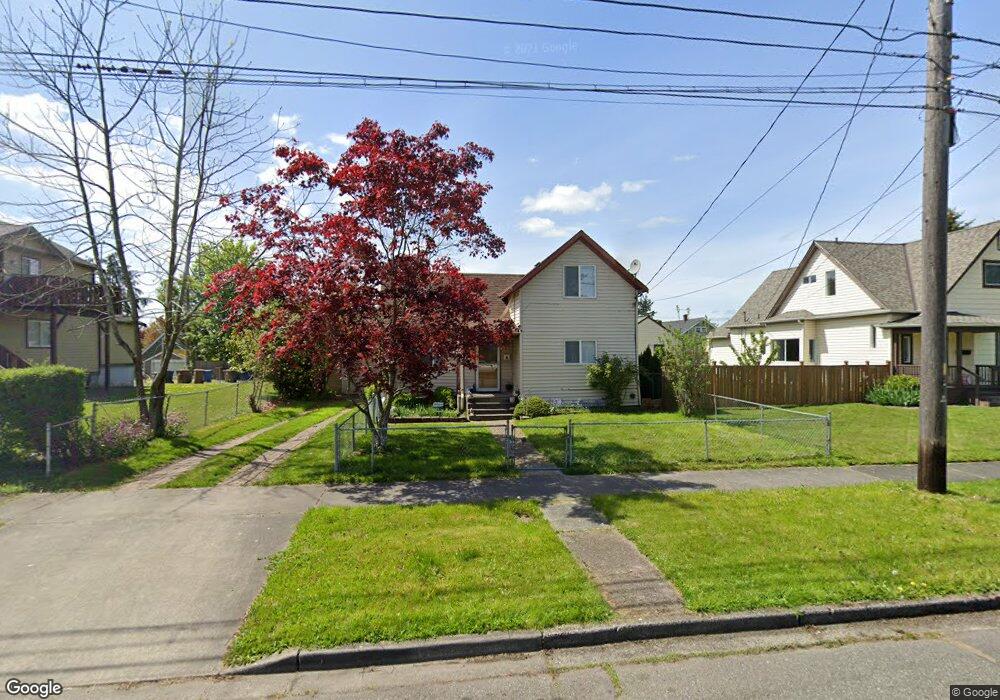
5028 S L St Tacoma, WA 98408
South End NeighborhoodEstimated Value: $400,463 - $442,000
3
Beds
1
Bath
1,198
Sq Ft
$350/Sq Ft
Est. Value
About This Home
This home is located at 5028 S L St, Tacoma, WA 98408 and is currently estimated at $419,116, approximately $349 per square foot. 5028 S L St is a home located in Pierce County with nearby schools including Mann Elementary School, Angelo Giaudrone Middle School, and Lincoln High School.
Ownership History
Date
Name
Owned For
Owner Type
Purchase Details
Closed on
Oct 21, 1999
Sold by
Bostain Christopher S
Bought by
Rivera Cynthia A
Current Estimated Value
Home Financials for this Owner
Home Financials are based on the most recent Mortgage that was taken out on this home.
Original Mortgage
$98,314
Outstanding Balance
$29,662
Interest Rate
7.82%
Mortgage Type
FHA
Estimated Equity
$389,454
Purchase Details
Closed on
Dec 10, 1997
Sold by
Spence David A
Bought by
Bostain Christopher S and Holtzclaw Jamie L
Home Financials for this Owner
Home Financials are based on the most recent Mortgage that was taken out on this home.
Original Mortgage
$79,568
Interest Rate
7.23%
Mortgage Type
FHA
Create a Home Valuation Report for This Property
The Home Valuation Report is an in-depth analysis detailing your home's value as well as a comparison with similar homes in the area
Home Values in the Area
Average Home Value in this Area
Purchase History
| Date | Buyer | Sale Price | Title Company |
|---|---|---|---|
| Rivera Cynthia A | $115,118 | -- | |
| Bostain Christopher S | $93,071 | -- |
Source: Public Records
Mortgage History
| Date | Status | Borrower | Loan Amount |
|---|---|---|---|
| Open | Rivera Cynthia A | $98,314 | |
| Previous Owner | Bostain Christopher S | $79,568 | |
| Closed | Rivera Cynthia A | $2,000 |
Source: Public Records
Tax History Compared to Growth
Tax History
| Year | Tax Paid | Tax Assessment Tax Assessment Total Assessment is a certain percentage of the fair market value that is determined by local assessors to be the total taxable value of land and additions on the property. | Land | Improvement |
|---|---|---|---|---|
| 2025 | $3,737 | $360,100 | $208,100 | $152,000 |
| 2024 | $3,737 | $355,900 | $201,100 | $154,800 |
| 2023 | $3,737 | $335,400 | $188,900 | $146,500 |
| 2022 | $3,382 | $355,300 | $185,400 | $169,900 |
| 2021 | $3,089 | $245,500 | $106,900 | $138,600 |
| 2019 | $2,552 | $225,600 | $93,100 | $132,500 |
| 2018 | $2,796 | $196,100 | $81,000 | $115,100 |
| 2017 | $2,389 | $176,800 | $58,900 | $117,900 |
| 2016 | $2,122 | $129,400 | $43,000 | $86,400 |
| 2014 | $1,880 | $121,900 | $41,900 | $80,000 |
| 2013 | $1,880 | $112,400 | $38,300 | $74,100 |
Source: Public Records
Map
Nearby Homes