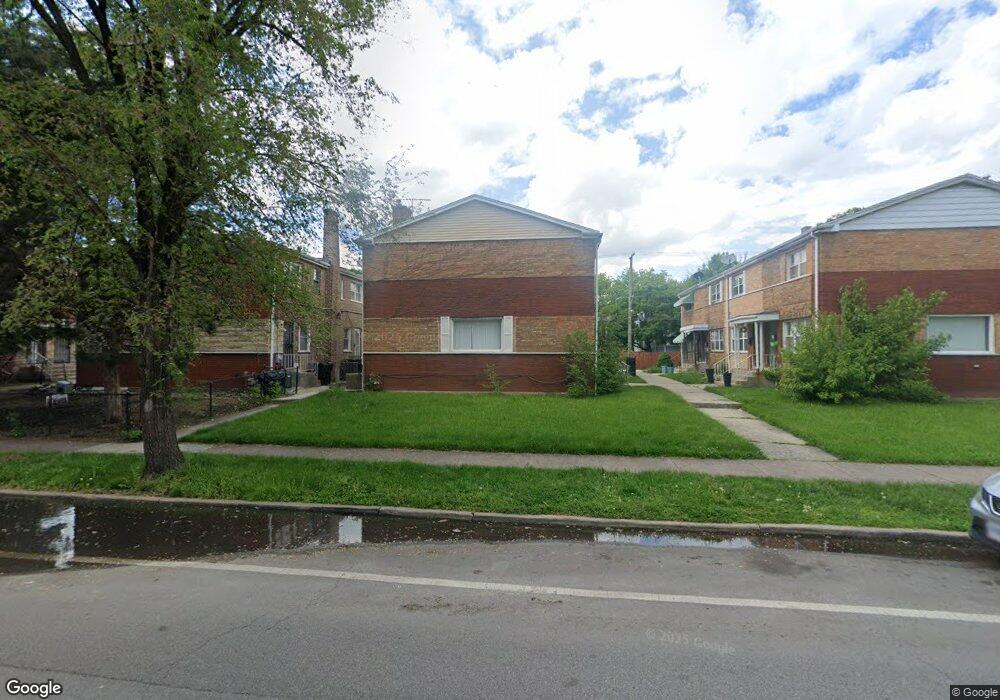
5028 W Jackson Blvd Chicago, IL 60644
Austin NeighborhoodEstimated Value: $89,000 - $124,000
2
Beds
2
Baths
1,038
Sq Ft
$102/Sq Ft
Est. Value
About This Home
This home is located at 5028 W Jackson Blvd, Chicago, IL 60644 and is currently estimated at $106,144, approximately $102 per square foot. 5028 W Jackson Blvd is a home located in Cook County with nearby schools including Leland Elementary School, KIPP Academy Chicago Campus, and Chicago Jesuit Academy.
Ownership History
Date
Name
Owned For
Owner Type
Purchase Details
Closed on
Sep 30, 2010
Sold by
Bassett Henry
Bought by
J & B Vii Property Management Inc
Current Estimated Value
Purchase Details
Closed on
Mar 20, 2009
Sold by
Us Bank Na
Bought by
Bassett Henry
Purchase Details
Closed on
Dec 24, 2008
Sold by
Brooks Brenda
Bought by
Us Bank National Association
Purchase Details
Closed on
Feb 28, 2006
Sold by
Powell Jonell
Bought by
Brooks Brenda
Home Financials for this Owner
Home Financials are based on the most recent Mortgage that was taken out on this home.
Original Mortgage
$57,600
Interest Rate
7.3%
Mortgage Type
Stand Alone First
Purchase Details
Closed on
Sep 25, 2005
Sold by
Powell Charles
Bought by
Powell Jonell
Create a Home Valuation Report for This Property
The Home Valuation Report is an in-depth analysis detailing your home's value as well as a comparison with similar homes in the area
Home Values in the Area
Average Home Value in this Area
Purchase History
| Date | Buyer | Sale Price | Title Company |
|---|---|---|---|
| J & B Vii Property Management Inc | -- | None Available | |
| Bassett Henry | $27,500 | Chicago Title Insurance Comp | |
| Us Bank National Association | -- | None Available | |
| Brooks Brenda | $72,000 | Ticor Title Insurance Compan | |
| Powell Jonell | -- | Ticor Title Insurance Compan |
Source: Public Records
Mortgage History
| Date | Status | Borrower | Loan Amount |
|---|---|---|---|
| Previous Owner | Brooks Brenda | $14,400 | |
| Previous Owner | Brooks Brenda | $57,600 |
Source: Public Records
Tax History Compared to Growth
Tax History
| Year | Tax Paid | Tax Assessment Tax Assessment Total Assessment is a certain percentage of the fair market value that is determined by local assessors to be the total taxable value of land and additions on the property. | Land | Improvement |
|---|---|---|---|---|
| 2024 | $1,477 | $9,100 | $1,912 | $7,188 |
| 2023 | $1,440 | $7,001 | $1,554 | $5,447 |
| 2022 | $1,440 | $7,001 | $1,554 | $5,447 |
| 2021 | $1,407 | $6,999 | $1,553 | $5,446 |
| 2020 | $1,640 | $7,363 | $1,553 | $5,810 |
| 2019 | $1,644 | $8,182 | $1,553 | $6,629 |
| 2018 | $1,616 | $8,182 | $1,553 | $6,629 |
| 2017 | $1,570 | $7,294 | $1,374 | $5,920 |
| 2016 | $1,461 | $7,294 | $1,374 | $5,920 |
| 2015 | $1,337 | $7,294 | $1,374 | $5,920 |
| 2014 | $1,322 | $7,123 | $1,314 | $5,809 |
| 2013 | $1,295 | $7,123 | $1,314 | $5,809 |
Source: Public Records
Map
Nearby Homes
- 5065 W Gladys Ave Unit C
- 5100 W Quincy St
- 4910 W Gladys Ave
- 4918 W Monroe St
- 4935 W Monroe St
- 4856 W Jackson Blvd
- 5068 W Congress Pkwy
- 5092 W Monroe St
- 5125 W Monroe St
- 4747 W Monroe St
- 4948 W Washington Blvd
- 4832 W Harrison St
- 4607 W Madison St
- 4733 W Gladys Ave
- 5153 W Washington Blvd
- 5246 W Congress Pkwy
- 4821 W Washington Blvd
- 4600 W Flournoy St
- 5005 W West End Ave
- 4718 W Monroe St
- 5028 W Jackson Blvd
- 5028 W Jackson Blvd
- 5028 W Jackson Blvd
- 5024 W Jackson Blvd
- 5024 W Jackson Blvd
- 5024 W Jackson Blvd
- 5024 W Jackson Blvd
- 5032 W Jackson Blvd
- 5032 W Jackson Blvd
- 5032 W Jackson Blvd
- 5032 W Jackson Blvd
- 5018 W Jackson Blvd
- 5038 W Jackson Blvd
- 5038 W Jackson Blvd
- 5038 W Jackson Blvd
- 5038 W Jackson Blvd
- 5038 W Jackson Blvd Unit B
- 5035 W Jackson Blvd
- 5035 W Jackson Blvd
- 5035 W Jackson Blvd