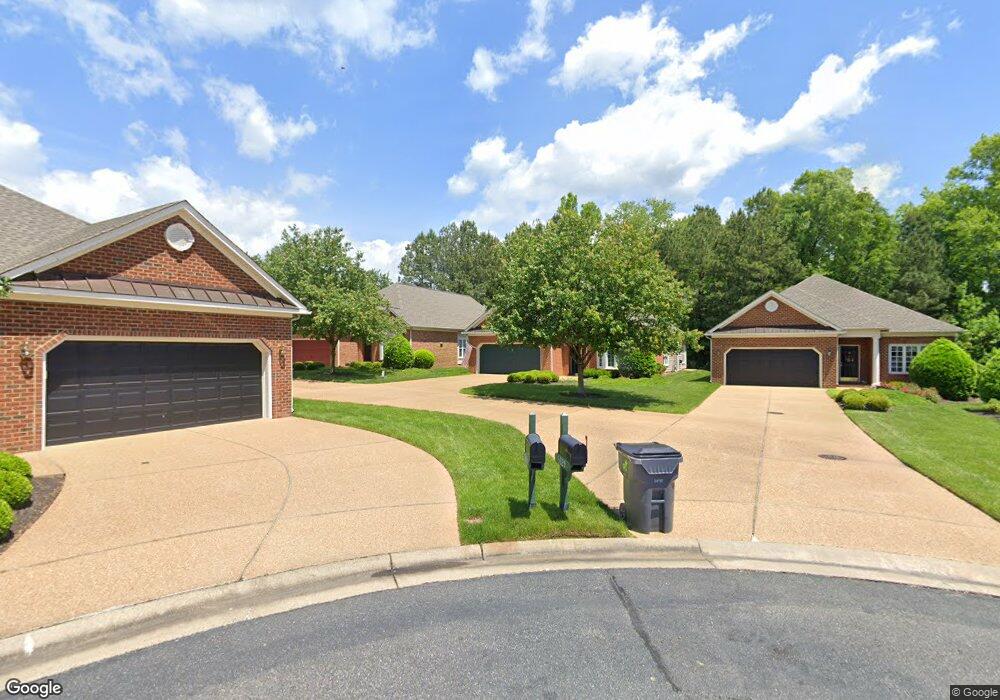
5029 Hickory Downs Ct Unit 19 Glen Allen, VA 23059
Twin Hickory NeighborhoodEstimated Value: $539,523 - $558,000
3
Beds
2
Baths
1,951
Sq Ft
$283/Sq Ft
Est. Value
About This Home
This home is located at 5029 Hickory Downs Ct Unit 19, Glen Allen, VA 23059 and is currently estimated at $552,381, approximately $283 per square foot. 5029 Hickory Downs Ct Unit 19 is a home located in Henrico County with nearby schools including Twin Hickory Elementary School, Holman Middle School, and Deep Run High School.
Ownership History
Date
Name
Owned For
Owner Type
Purchase Details
Closed on
Nov 18, 2024
Sold by
Rankin Irrevocable Trust and Maher Elaine Rankin
Bought by
Love James Thomas and Love Ruth Ellen
Current Estimated Value
Purchase Details
Closed on
Dec 21, 2020
Sold by
Rankin Spencer J
Bought by
Maher Elaine Rankin and The Rankin Irrevocable Trust
Purchase Details
Closed on
Jul 24, 2020
Sold by
Aubry Donna E
Bought by
Rankin Spencer J
Purchase Details
Closed on
Feb 1, 2005
Sold by
Barzel Roy I
Bought by
Aubrey Donna E
Home Financials for this Owner
Home Financials are based on the most recent Mortgage that was taken out on this home.
Original Mortgage
$280,500
Interest Rate
5.77%
Mortgage Type
New Conventional
Create a Home Valuation Report for This Property
The Home Valuation Report is an in-depth analysis detailing your home's value as well as a comparison with similar homes in the area
Home Values in the Area
Average Home Value in this Area
Purchase History
| Date | Buyer | Sale Price | Title Company |
|---|---|---|---|
| Love James Thomas | $550,000 | First American Title | |
| Love James Thomas | $550,000 | First American Title | |
| Maher Elaine Rankin | -- | None Available | |
| Rankin Spencer J | $401,000 | Attorney | |
| Aubrey Donna E | $330,000 | -- |
Source: Public Records
Mortgage History
| Date | Status | Borrower | Loan Amount |
|---|---|---|---|
| Previous Owner | Aubrey Donna E | $280,500 |
Source: Public Records
Tax History Compared to Growth
Tax History
| Year | Tax Paid | Tax Assessment Tax Assessment Total Assessment is a certain percentage of the fair market value that is determined by local assessors to be the total taxable value of land and additions on the property. | Land | Improvement |
|---|---|---|---|---|
| 2025 | $4,094 | $467,200 | $110,000 | $357,200 |
| 2024 | $4,094 | $452,000 | $110,000 | $342,000 |
| 2023 | $3,842 | $452,000 | $110,000 | $342,000 |
| 2022 | $3,483 | $409,800 | $100,000 | $309,800 |
| 2021 | $3,404 | $382,800 | $90,000 | $292,800 |
| 2020 | $3,330 | $382,800 | $90,000 | $292,800 |
| 2019 | $3,225 | $370,700 | $90,000 | $280,700 |
| 2018 | $2,975 | $341,900 | $80,000 | $261,900 |
| 2017 | $2,975 | $341,900 | $80,000 | $261,900 |
| 2016 | $2,975 | $341,900 | $80,000 | $261,900 |
| 2015 | $2,686 | $341,900 | $80,000 | $261,900 |
| 2014 | $2,686 | $308,700 | $80,000 | $228,700 |
Source: Public Records
Map
Nearby Homes
- 11944 Belmont Park Ct
- 11532 Saddleridge Rd
- 5132 Park Commons Loop
- 5004 Parkcrest Ct
- 5046 Willows Green Rd
- 5012 Park Commons Loop
- 918 Jamerson Ln Unit 918
- 305 Jamerson Ct
- 11700 Autumnwood Ct
- 4905 Old Millrace Place
- 11012 Ellis Meadows Ln
- 12109 Oxford Landing Dr Unit 104
- 12109 Oxford Landing Dr Unit 201
- 12109 Oxford Landing Dr Unit 102
- 11539 Sadler Grove Rd
- 5004 Sadler Place Terrace
- 0 Manakin Rd Unit VAGO2000320
- 4501 Hickory Lake Ct
- 5614 Benoni Ct
- 11141 Opaca Ln
- 5033 Hickory Downs Ct Unit 20
- 5025 Hickory Downs Ct
- 5025 Hickory Downs Ct Unit 18
- 5021 Hickory Downs Ct
- 5021 Hickory Downs Ct Unit 17
- 5020 Hickory Downs Ct
- 5009 Hickory Downs Ct
- 4905 Hickory Downs Dr
- 5020 Hickory Downs Ct
- 4905 Hickory Downs Dr Unit 42
- 5017 Hickory Downs Ct
- 5017 Hickory Downs Ct Unit 5017
- 4901 Hickory Downs Dr
- 4901 Hickory Downs Dr Unit 41
- 5112 Belmont Park Rd
- 5112 Belmont Park Rd Unit 2
- 5016 Hickory Downs Ct
- 5116 Belmont Park Rd
- 5116 Belmont Park Rd Unit 1
- 5020 Belmont Park Rd Unit 5020