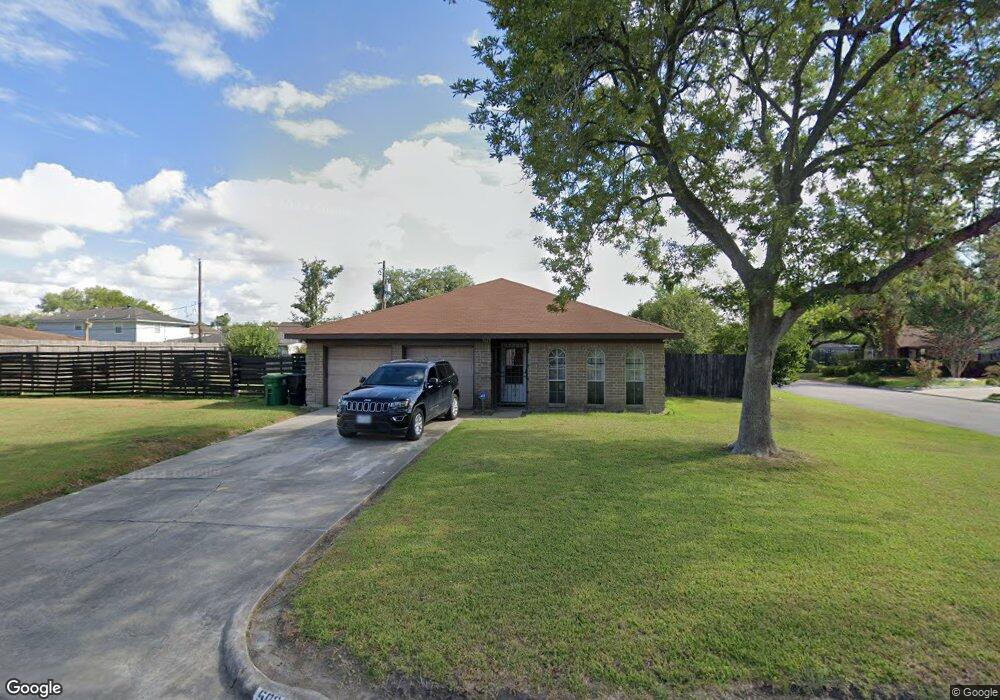
5029 Redbud St Houston, TX 77033
Sunnyside NeighborhoodEstimated Value: $238,000 - $284,000
3
Beds
3
Baths
1,547
Sq Ft
$169/Sq Ft
Est. Value
About This Home
This home is located at 5029 Redbud St, Houston, TX 77033 and is currently estimated at $261,998, approximately $169 per square foot. 5029 Redbud St is a home located in Harris County with nearby schools including Bastian Elementary School, Attucks Middle School, and Worthing High School.
Ownership History
Date
Name
Owned For
Owner Type
Purchase Details
Closed on
Aug 4, 2014
Sold by
Porter William
Bought by
Porter Christopher
Current Estimated Value
Purchase Details
Closed on
May 2, 2014
Sold by
Porter Christopher
Bought by
Courtland Cyntayvia
Purchase Details
Closed on
Nov 7, 1997
Sold by
Linz Thelma C
Bought by
Porter William
Purchase Details
Closed on
Oct 20, 1997
Sold by
Richmond Elise J
Bought by
Lenz Thelma A
Create a Home Valuation Report for This Property
The Home Valuation Report is an in-depth analysis detailing your home's value as well as a comparison with similar homes in the area
Home Values in the Area
Average Home Value in this Area
Purchase History
| Date | Buyer | Sale Price | Title Company |
|---|---|---|---|
| Porter Christopher | -- | None Available | |
| Porter Christopher | -- | None Available | |
| Courtland Cyntayvia | -- | None Available | |
| Porter William | -- | -- | |
| Lenz Thelma A | -- | -- |
Source: Public Records
Tax History Compared to Growth
Tax History
| Year | Tax Paid | Tax Assessment Tax Assessment Total Assessment is a certain percentage of the fair market value that is determined by local assessors to be the total taxable value of land and additions on the property. | Land | Improvement |
|---|---|---|---|---|
| 2025 | $1,107 | $312,877 | $144,619 | $168,258 |
| 2024 | $1,107 | $312,542 | $144,619 | $167,923 |
| 2023 | $943 | $248,364 | $115,695 | $132,669 |
| 2022 | $2,052 | $248,364 | $115,695 | $132,669 |
| 2021 | $1,974 | $200,327 | $77,130 | $123,197 |
| 2020 | $1,865 | $179,467 | $67,489 | $111,978 |
| 2019 | $1,771 | $70,000 | $28,924 | $41,076 |
| 2018 | $1,122 | $70,000 | $28,924 | $41,076 |
| 2017 | $1,770 | $70,000 | $28,924 | $41,076 |
| 2016 | $1,121 | $0 | $0 | $0 |
| 2015 | $1,578 | $106,235 | $22,163 | $84,072 |
| 2014 | $1,578 | $85,000 | $22,163 | $62,837 |
Source: Public Records
Map
Nearby Homes
- 7810 Darnay Dr
- 4930 Teton St
- 5115 Briscoe St Unit A/B
- 5019 Edfield St
- 5007 Edfield St
- 0000 Darnay Dr
- 5027 Willow Glen Dr Unit A-B
- 4911 Edfield St
- 5103 Northridge Dr
- 4843 Bricker St
- 5102 Lyndhurst Dr
- 4830 Teton St
- 5123 Northridge Dr
- 4903 Mayflower St
- 7606 Darnay Dr
- 8107 Calhoun Rd
- 4741 Bricker St
- 5215 Myrtlewood St
- 5231 Lyndhurst Dr
- 8201 Calhoun Rd Unit A/B