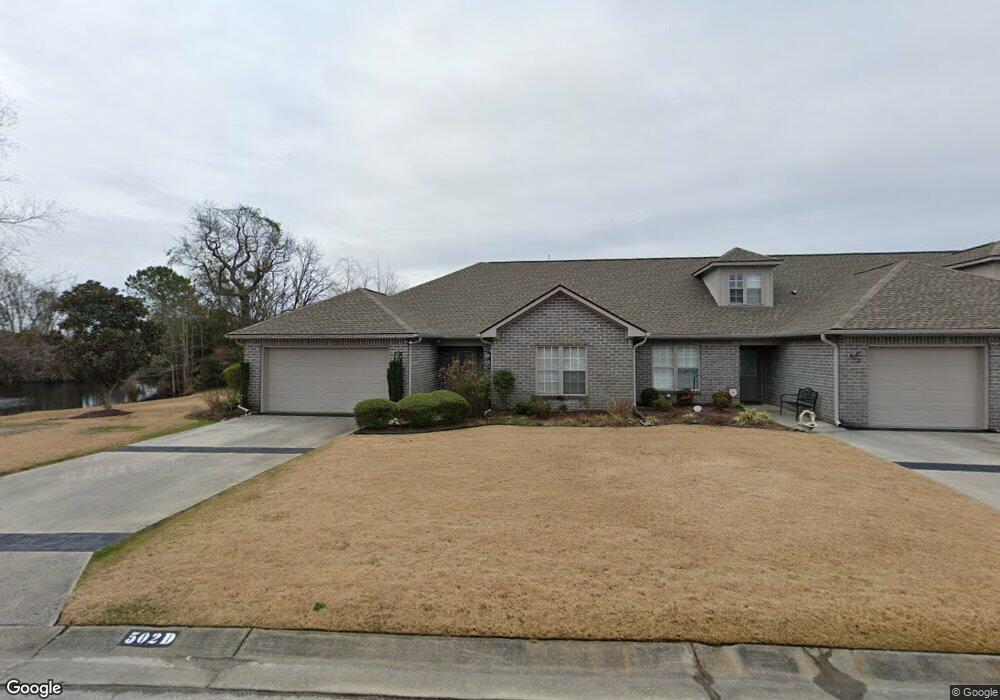
502D Castle Bay Dr Hampstead, NC 28443
Estimated Value: $293,000 - $323,000
2
Beds
2
Baths
1,459
Sq Ft
$208/Sq Ft
Est. Value
About This Home
This home is located at 502D Castle Bay Dr, Hampstead, NC 28443 and is currently estimated at $303,271, approximately $207 per square foot. 502D Castle Bay Dr is a home located in Pender County with nearby schools including South Topsail Elementary School, Topsail Middle School, and Topsail High School.
Ownership History
Date
Name
Owned For
Owner Type
Purchase Details
Closed on
Apr 14, 2021
Sold by
Schuster John M and Wilson Deborrah A
Bought by
King Linda
Current Estimated Value
Home Financials for this Owner
Home Financials are based on the most recent Mortgage that was taken out on this home.
Original Mortgage
$175,920
Outstanding Balance
$158,834
Interest Rate
3%
Mortgage Type
New Conventional
Estimated Equity
$144,437
Purchase Details
Closed on
Feb 19, 2014
Sold by
Wilson Deborah A
Bought by
Schuster John M
Purchase Details
Closed on
Nov 23, 2011
Sold by
Schuster John M and Wilson Deborrah A
Bought by
Wilson Deborrah A and Schuster John M
Purchase Details
Closed on
Aug 5, 2005
Sold by
Balnton Randy L and Balnton Judy H
Bought by
Wilson Deborrah A and Schuster John M
Home Financials for this Owner
Home Financials are based on the most recent Mortgage that was taken out on this home.
Original Mortgage
$90,000
Interest Rate
5.51%
Mortgage Type
New Conventional
Create a Home Valuation Report for This Property
The Home Valuation Report is an in-depth analysis detailing your home's value as well as a comparison with similar homes in the area
Home Values in the Area
Average Home Value in this Area
Purchase History
| Date | Buyer | Sale Price | Title Company |
|---|---|---|---|
| King Linda | $220,000 | None Available | |
| King Linda | $220,000 | None Listed On Document | |
| Schuster John M | -- | None Available | |
| Wilson Deborrah A | -- | None Available | |
| Wilson Deborrah A | $173,500 | -- |
Source: Public Records
Mortgage History
| Date | Status | Borrower | Loan Amount |
|---|---|---|---|
| Open | King Linda | $175,920 | |
| Previous Owner | Wilson Deborrah A | $90,000 |
Source: Public Records
Tax History Compared to Growth
Tax History
| Year | Tax Paid | Tax Assessment Tax Assessment Total Assessment is a certain percentage of the fair market value that is determined by local assessors to be the total taxable value of land and additions on the property. | Land | Improvement |
|---|---|---|---|---|
| 2024 | $1,805 | $173,537 | $38,981 | $134,556 |
| 2023 | $1,805 | $173,537 | $38,981 | $134,556 |
| 2022 | $1,665 | $173,537 | $38,981 | $134,556 |
| 2021 | $1,665 | $173,537 | $38,981 | $134,556 |
| 2020 | $1,611 | $167,112 | $38,981 | $128,131 |
| 2019 | $1,611 | $167,112 | $38,981 | $128,131 |
| 2018 | $1,556 | $153,092 | $12,000 | $141,092 |
| 2017 | $1,556 | $153,092 | $12,000 | $141,092 |
| 2016 | $1,540 | $153,092 | $12,000 | $141,092 |
| 2015 | $1,505 | $153,092 | $12,000 | $141,092 |
| 2014 | $1,198 | $153,092 | $12,000 | $141,092 |
| 2013 | -- | $153,092 | $12,000 | $141,092 |
| 2012 | -- | $153,092 | $12,000 | $141,092 |
Source: Public Records
Map
Nearby Homes
- 607 Castle Bay Dr
- 399 Castle Bay Dr Unit D
- 115 Castle Bay Dr
- 325 Highlands Dr
- 82 Highlands Dr
- 35 Scotlands Ct
- 18 E Pioneer Way Unit 74
- 12 W Farley Dr Unit 102
- 24 W Farley Dr Unit 99
- 28 W Farley Dr Unit 98
- 17 E Farley Dr Unit 70
- 25 E Farley Dr Unit 69
- 48 W Farley Dr Unit 93
- 155 Cobbler Way Unit 48
- 139 Cobbler Way Unit 46
- 131 Cobbler Way Unit 45
- 123 Cobbler Way Unit 44
- 116 Cobbler Way Unit 58
- 115 Cobbler Way Unit 43
- 108 Cobbler Way Unit 57
- 502C Castle Bay Dr
- 502 Castle Bay Dr
- 502B Castle Bay Dr
- 502A Castle Bay Dr
- 474 Castle Bay Dr
- 474A Castle Bay Dr
- 474 Castle Bay Dr Unit A
- 474 Castle Bay Dr Unit B
- 474C Castle Bay Dr
- 548 Castle Bay Dr
- 474B Castle Bay Dr
- 539 Castle Bay Dr
- 562 Castle Bay Dr
- 551 Castle Bay Dr
- 564 Castle Bay Dr
- 574 Castle Bay Dr
- 565 Castle Bay Dr
- 446D Castle Bay Dr
- 35 Moorehead Ct
- 427D Castle Bay Dr