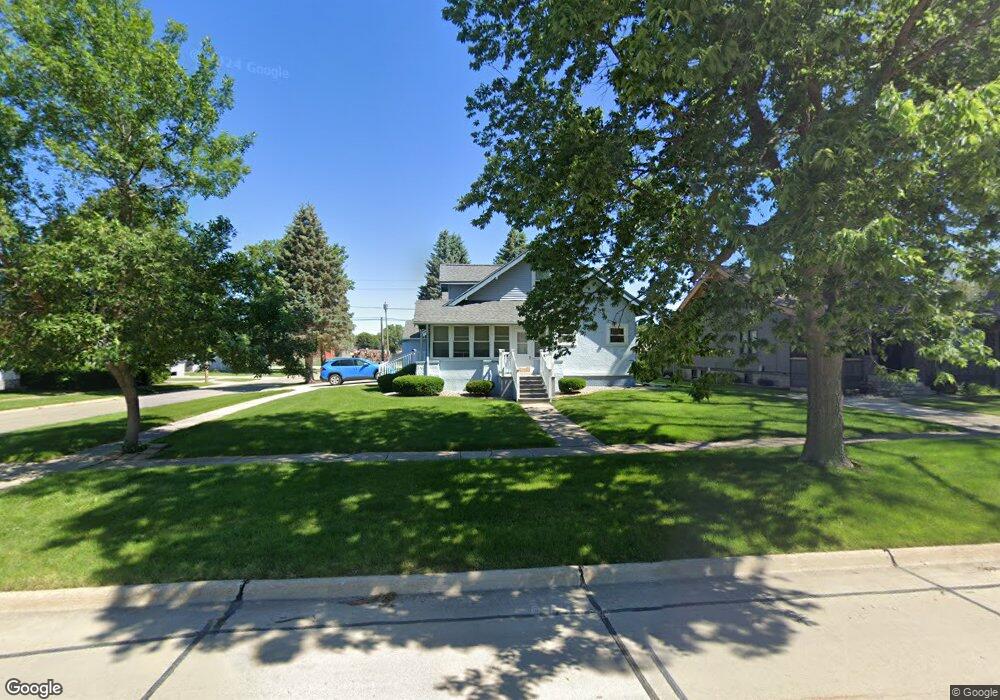
503 2nd Ave NE Clarion, IA 50525
Estimated Value: $142,000 - $179,000
4
Beds
3
Baths
2,003
Sq Ft
$80/Sq Ft
Est. Value
About This Home
This home is located at 503 2nd Ave NE, Clarion, IA 50525 and is currently estimated at $160,792, approximately $80 per square foot. 503 2nd Ave NE is a home located in Wright County with nearby schools including Clarion-Goldfield-Dows Elementary School, Clarion-Goldfield-Dows Middle School, and Clarion-Goldfield-Dows High School.
Ownership History
Date
Name
Owned For
Owner Type
Purchase Details
Closed on
Apr 15, 2005
Sold by
Schutt Shawn M and Dieken Bruce Allen
Bought by
Koob Michael L and Koob Linda K
Current Estimated Value
Home Financials for this Owner
Home Financials are based on the most recent Mortgage that was taken out on this home.
Original Mortgage
$46,600
Outstanding Balance
$24,204
Interest Rate
5.88%
Mortgage Type
New Conventional
Estimated Equity
$136,589
Create a Home Valuation Report for This Property
The Home Valuation Report is an in-depth analysis detailing your home's value as well as a comparison with similar homes in the area
Home Values in the Area
Average Home Value in this Area
Purchase History
| Date | Buyer | Sale Price | Title Company |
|---|---|---|---|
| Koob Michael L | $65,000 | None Available |
Source: Public Records
Mortgage History
| Date | Status | Borrower | Loan Amount |
|---|---|---|---|
| Open | Koob Michael L | $46,600 |
Source: Public Records
Tax History Compared to Growth
Tax History
| Year | Tax Paid | Tax Assessment Tax Assessment Total Assessment is a certain percentage of the fair market value that is determined by local assessors to be the total taxable value of land and additions on the property. | Land | Improvement |
|---|---|---|---|---|
| 2025 | -- | $124,000 | $9,700 | $114,300 |
| 2024 | $5 | $123,800 | $9,700 | $114,100 |
| 2023 | -- | $123,800 | $9,700 | $114,100 |
| 2022 | $0 | $104,800 | $9,700 | $95,100 |
| 2021 | $0 | $88,500 | $9,700 | $78,800 |
| 2020 | $5 | $88,500 | $9,700 | $78,800 |
| 2019 | $1,480 | $81,100 | $0 | $0 |
| 2018 | $1,480 | $80,900 | $0 | $0 |
| 2017 | $1,394 | $77,000 | $0 | $0 |
| 2016 | $1,330 | $77,000 | $0 | $0 |
| 2015 | $1,272 | $77,000 | $0 | $0 |
| 2014 | $1,272 | $74,500 | $0 | $0 |
Source: Public Records
Map
Nearby Homes
- 421 2nd Ave NE
- 603 1st Ave NE
- 212 3rd Ave NE
- 519 6th St NE
- 903 2nd Ave NE
- 620 Maple Ln
- 719 2nd St NE
- 120 1st Ave SE
- 1003 2nd Ave NE
- 213 8th St SE
- 306 White Fox Dr
- 219 8th Ave SE
- 1000 1st St SE
- 1221 S Main St
- 1513 2nd St SW
- 2412 188th St
- 2405 186th St Unit 1
- 2405 186th St Unit 2
- 1884 Obrien Ave
- 2189 Hancock Ave