Estimated Value: $72,813 - $128,000
--
Bed
2
Baths
1,120
Sq Ft
$83/Sq Ft
Est. Value
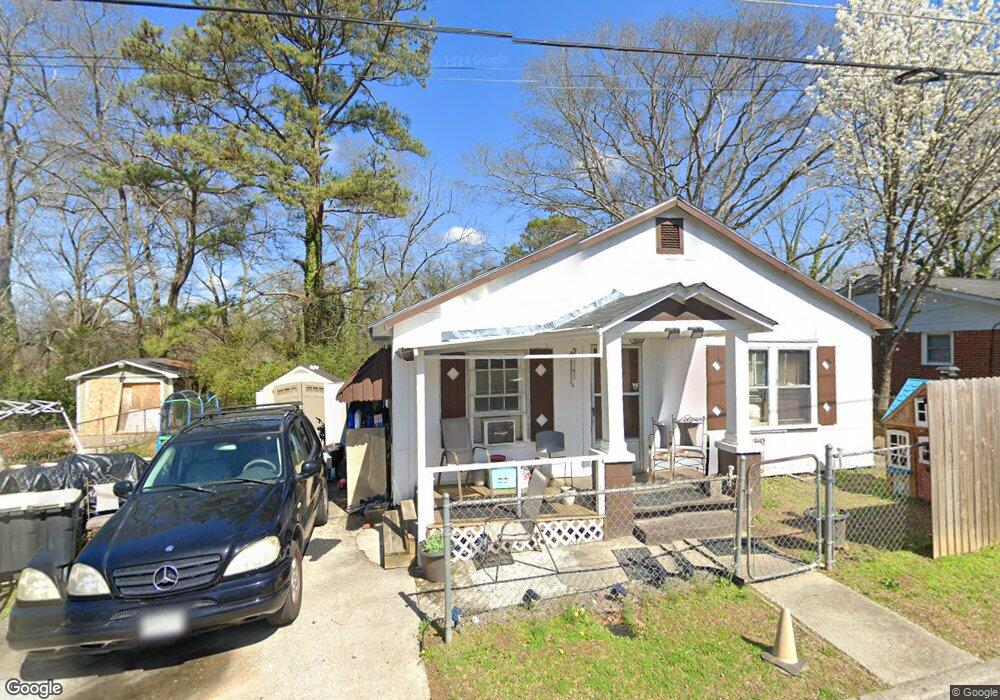
About This Home
This home is located at 503 Brown St SW, Rome, GA 30161 and is currently estimated at $92,703, approximately $82 per square foot. 503 Brown St SW is a home located in Floyd County with nearby schools including Rome High School, Darlington School, and Montessori School of Rome.
Ownership History
Date
Name
Owned For
Owner Type
Purchase Details
Closed on
Nov 12, 2008
Sold by
Johnson Agnes J
Bought by
Waddell Benjamin E
Current Estimated Value
Purchase Details
Closed on
Mar 11, 1997
Sold by
Johnson Walter L
Bought by
Johnson Agnes J and Johnson Walter L
Purchase Details
Closed on
Mar 23, 1994
Bought by
P and R
Purchase Details
Closed on
Oct 5, 1976
Sold by
Drawdy Richard
Bought by
Johnson Walter L
Purchase Details
Closed on
Jan 1, 1976
Sold by
Farmer Wallace A
Bought by
Drawdy Richard
Purchase Details
Closed on
Jan 2, 1974
Sold by
Cosper Willis E
Bought by
Farmer Wallace A
Purchase Details
Closed on
Jan 1, 1974
Sold by
A F H
Bought by
Cosper Willis E
Purchase Details
Closed on
Jan 1, 1973
Sold by
Rufus Neal Turner
Bought by
A F H
Purchase Details
Closed on
Jan 1, 1970
Sold by
Bishop Opal
Bought by
Rufus Neal Turner
Purchase Details
Closed on
Jan 1, 1901
Bought by
Bishop Opal
Create a Home Valuation Report for This Property
The Home Valuation Report is an in-depth analysis detailing your home's value as well as a comparison with similar homes in the area
Home Values in the Area
Average Home Value in this Area
Purchase History
| Date | Buyer | Sale Price | Title Company |
|---|---|---|---|
| Waddell Benjamin E | -- | -- | |
| Johnson Agnes J | -- | -- | |
| P | -- | -- | |
| Johnson Walter L | $17,600 | -- | |
| Drawdy Richard | $18,500 | -- | |
| Farmer Wallace A | -- | -- | |
| Cosper Willis E | $17,600 | -- | |
| A F H | $11,700 | -- | |
| Rufus Neal Turner | $11,000 | -- | |
| Bishop Opal | -- | -- |
Source: Public Records
Tax History
| Year | Tax Paid | Tax Assessment Tax Assessment Total Assessment is a certain percentage of the fair market value that is determined by local assessors to be the total taxable value of land and additions on the property. | Land | Improvement |
|---|---|---|---|---|
| 2025 | $923 | $25,819 | $4,743 | $21,076 |
| 2024 | $923 | $23,724 | $4,312 | $19,412 |
| 2023 | $840 | $22,491 | $3,920 | $18,571 |
| 2022 | $669 | $18,343 | $3,136 | $15,207 |
| 2021 | $619 | $16,679 | $3,136 | $13,543 |
| 2020 | $567 | $15,152 | $2,450 | $12,702 |
| 2019 | $530 | $14,311 | $2,450 | $11,861 |
| 2018 | $495 | $13,365 | $2,450 | $10,915 |
| 2017 | $476 | $12,857 | $2,450 | $10,407 |
| 2016 | $462 | $12,443 | $2,440 | $10,003 |
| 2015 | $436 | $12,443 | $2,440 | $10,003 |
| 2014 | $436 | $12,443 | $2,440 | $10,003 |
Source: Public Records
Map
Nearby Homes
- 1705 Olmstead St SW
- 407 E 18th St SW
- 407 E 19th St SW
- 408 E 18th St
- 304 E 19th St SW
- 111 Hosea St SW
- 39 E 16th St SW
- 118 Hosea St SW
- 1901 Hull Ave SW
- 7 Willingham St SW
- 525 E 14th St SW
- 2009 Hull Ave SW
- 421 Cedar Ave SW
- 2108 Maple Ave SW
- 419 E 13th St SW
- 117 E Boundary St SE
- 115 E Boundary St SE
- 1314 E 2nd Ave SE
- 1407 E 2nd Ave SE
- 170 E 11th St SW
- 505 Brown St SW
- 0 Brown St SW Unit 20167341
- 513 Brown St SW
- 402 E 18th St SW
- 402 E 18th St SW
- 402 E 18th St SW
- 500 Brown St SW
- 1801 Olmstead St SW
- 504 Brown St SW
- 506 Brown St SW
- 411 Brown St SW
- 1803 Olmstead St SW
- 1710 Olmstead St SW
- 507 Brown St SW
- 511 Brown St SW
- 510 Brown St
- 1800 Olmstead St SW
- 1800 Olmstead St SW Unit 10
- 503 E 19th St SW
- 310 E 18th St SW
Your Personal Tour Guide
Ask me questions while you tour the home.