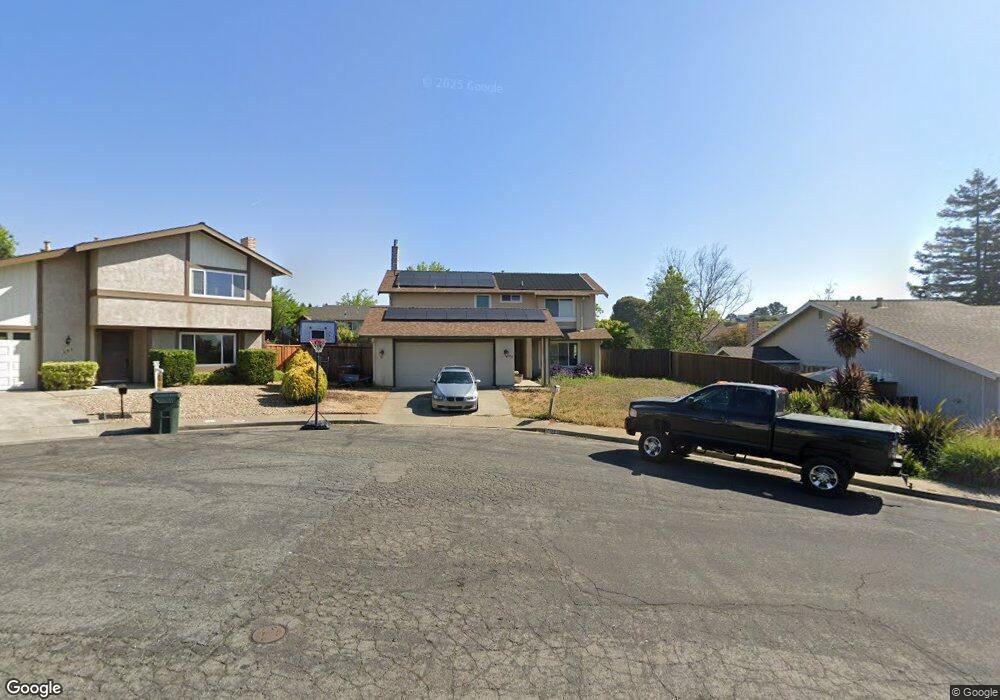
503 Byron Ct Benicia, CA 94510
Estimated Value: $846,000 - $967,000
4
Beds
3
Baths
2,164
Sq Ft
$417/Sq Ft
Est. Value
About This Home
This home is located at 503 Byron Ct, Benicia, CA 94510 and is currently estimated at $902,186, approximately $416 per square foot. 503 Byron Ct is a home located in Solano County with nearby schools including Joe Henderson Elementary School, Benicia Middle School, and Benicia High School.
Ownership History
Date
Name
Owned For
Owner Type
Purchase Details
Closed on
Aug 19, 2021
Sold by
Brown Dennis M and Brown Nicole A
Bought by
Michael Brown And Nicole Brown Revocable Fami and Brown
Current Estimated Value
Purchase Details
Closed on
Jun 9, 2014
Sold by
Kesteloot Roger D and Kesteloot Irene L
Bought by
Brown Dennis M and Brown Nicole A
Home Financials for this Owner
Home Financials are based on the most recent Mortgage that was taken out on this home.
Original Mortgage
$520,493
Interest Rate
4.16%
Mortgage Type
New Conventional
Create a Home Valuation Report for This Property
The Home Valuation Report is an in-depth analysis detailing your home's value as well as a comparison with similar homes in the area
Home Values in the Area
Average Home Value in this Area
Purchase History
| Date | Buyer | Sale Price | Title Company |
|---|---|---|---|
| Michael Brown And Nicole Brown Revocable Fami | -- | Grant Kayla | |
| Brown Dennis M | $578,500 | First American Title Company |
Source: Public Records
Mortgage History
| Date | Status | Borrower | Loan Amount |
|---|---|---|---|
| Previous Owner | Brown Dennis M | $520,493 |
Source: Public Records
Tax History
| Year | Tax Paid | Tax Assessment Tax Assessment Total Assessment is a certain percentage of the fair market value that is determined by local assessors to be the total taxable value of land and additions on the property. | Land | Improvement |
|---|---|---|---|---|
| 2025 | $8,309 | $708,935 | $183,874 | $525,061 |
| 2024 | $8,309 | $695,035 | $180,269 | $514,766 |
| 2023 | $8,109 | $681,408 | $176,735 | $504,673 |
| 2022 | $7,958 | $668,048 | $173,270 | $494,778 |
| 2021 | $7,797 | $654,950 | $169,873 | $485,077 |
| 2020 | $7,693 | $648,236 | $168,132 | $480,104 |
| 2019 | $7,559 | $635,527 | $164,836 | $470,691 |
| 2018 | $7,366 | $623,066 | $161,604 | $461,462 |
| 2017 | $7,196 | $610,850 | $158,436 | $452,414 |
| 2016 | $7,260 | $598,874 | $155,330 | $443,544 |
| 2015 | $7,077 | $589,879 | $152,997 | $436,882 |
| 2014 | $3,390 | $287,320 | $74,953 | $212,367 |
Source: Public Records
Map
Nearby Homes
- 507 Union Ct
- 900 Cambridge Dr Unit 122
- 900 Cambridge Dr Unit 95
- 900 Cambridge Dr Unit 114
- 900 Cambridge Dr Unit 104
- 1474 London Cir
- 446 York Dr
- 1740 Stuart Ct
- 460 Turner Dr
- 494 Mills Dr
- 902 Bolton Cir
- 1196 Grove Cir
- 1229 Monte Vista Ct
- 403 Gerald Ct
- 659 Rose Dr
- 1190 Church St
- 900 Southampton Rd Unit 110
- 900 Southampton Rd Unit 2
- 900 Southampton Rd Unit 140
- 900 Southampton Rd
Your Personal Tour Guide
Ask me questions while you tour the home.