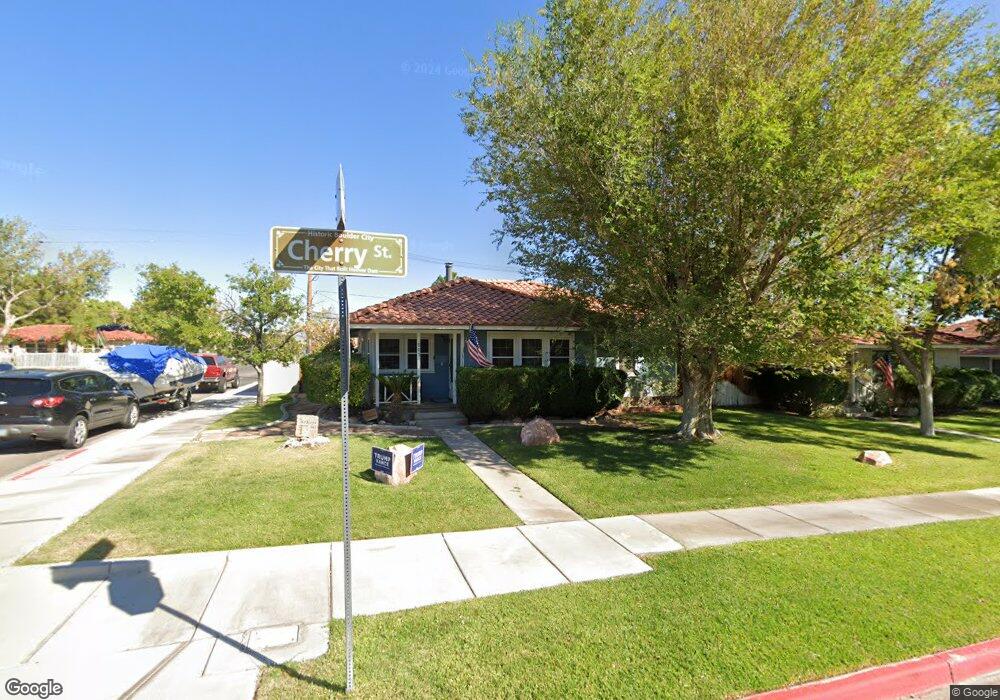
503 Cherry St Boulder City, NV 89005
Estimated Value: $374,000 - $503,000
3
Beds
1
Bath
1,168
Sq Ft
$363/Sq Ft
Est. Value
About This Home
This home is located at 503 Cherry St, Boulder City, NV 89005 and is currently estimated at $424,235, approximately $363 per square foot. 503 Cherry St is a home located in Clark County with nearby schools including Andrew Mitchell Elementary School, Martha P. King Elementary School, and Elton M. & Madelaine E. Garrett Junior High School.
Ownership History
Date
Name
Owned For
Owner Type
Purchase Details
Closed on
Jul 31, 2023
Sold by
Mckay Anna G
Bought by
Mckay Daniel D
Current Estimated Value
Purchase Details
Closed on
Nov 2, 2020
Sold by
Mckay Anna G
Bought by
Mckay Daniel D
Home Financials for this Owner
Home Financials are based on the most recent Mortgage that was taken out on this home.
Original Mortgage
$136,000
Interest Rate
2.9%
Mortgage Type
New Conventional
Purchase Details
Closed on
Sep 24, 2013
Sold by
Mckay Daniel D and Mckay Tami J
Bought by
Mckay Daniel D
Purchase Details
Closed on
Dec 24, 1997
Sold by
Mckay Daniel D
Bought by
Mckay Daniel D and Mckay Tami J
Purchase Details
Closed on
Dec 22, 1997
Sold by
Mckay Daniel D and Mckay Paul
Bought by
Mckay Daniel D
Create a Home Valuation Report for This Property
The Home Valuation Report is an in-depth analysis detailing your home's value as well as a comparison with similar homes in the area
Home Values in the Area
Average Home Value in this Area
Purchase History
| Date | Buyer | Sale Price | Title Company |
|---|---|---|---|
| Mckay Daniel D | -- | Security 1St Title | |
| Mckay Daniel D | -- | Driggs Title Agency Inc | |
| Mckay Daniel D | -- | Nevada Title | |
| Mckay Daniel D | -- | Nevada Title Company | |
| Mckay Daniel D | -- | Nevada Title Company |
Source: Public Records
Mortgage History
| Date | Status | Borrower | Loan Amount |
|---|---|---|---|
| Previous Owner | Mckay Daniel D | $136,000 |
Source: Public Records
Tax History
| Year | Tax Paid | Tax Assessment Tax Assessment Total Assessment is a certain percentage of the fair market value that is determined by local assessors to be the total taxable value of land and additions on the property. | Land | Improvement |
|---|---|---|---|---|
| 2026 | $1,345 | $76,593 | $55,650 | $20,943 |
| 2025 | $1,245 | $69,846 | $49,000 | $20,846 |
| 2024 | $1,153 | $69,846 | $49,000 | $20,846 |
| 2023 | $1,153 | $55,535 | $36,750 | $18,785 |
| 2022 | $1,067 | $50,019 | $33,250 | $16,769 |
| 2021 | $988 | $46,060 | $30,450 | $15,610 |
| 2020 | $918 | $43,905 | $28,700 | $15,205 |
| 2019 | $860 | $40,907 | $26,250 | $14,657 |
| 2018 | $821 | $36,555 | $22,750 | $13,805 |
| 2017 | $906 | $34,678 | $21,000 | $13,678 |
| 2016 | $768 | $29,562 | $15,750 | $13,812 |
| 2015 | $766 | $29,127 | $15,750 | $13,377 |
| 2014 | $750 | $28,663 | $15,750 | $12,913 |
Source: Public Records
Map
Nearby Homes
- 507 Cherry St
- 511 Cherry St
- 1608 Arizona St Unit 1620
- 1608 Arizona St
- 504 Birch St
- 508 Birch St
- 1612 Arizona St
- 504 Cherry St
- 515 Cherry St
- 512 Birch St
- 1620 Arizona St Unit 1608
- 1620 Arizona St
- 438 Birch St
- 508 Cherry St
- 512 Cherry St
- 516 Birch St
- 430 Birch St Unit 430
- 430 Birch St
- 430 Birch St Unit n/a
- 495 Railroad Ave
Your Personal Tour Guide
Ask me questions while you tour the home.